The natural gas prime season is heating up right now.
I have studied its seasonal analysis over the last 10 years, and there’s a clear trend higher from early April through mid-June.
Any day now I’ll get my buy signal to jump in and benefit from this seasonal trend.
But what I wanted to share with you today is that I love when multiple analyses all point to the same outcome — natural gas prices rising.
See, trading one strategy is fine. It will work out great and give you great entry signals. It doesn’t beat seeing multiple strategies showing you the same thing, though, and that’s where we are today with natural gas.
Natural Gas Prime Season
We just entered its bullish seasonal trend.
A momentum indicator I track to enter positions is about to give a major buy signal as well.
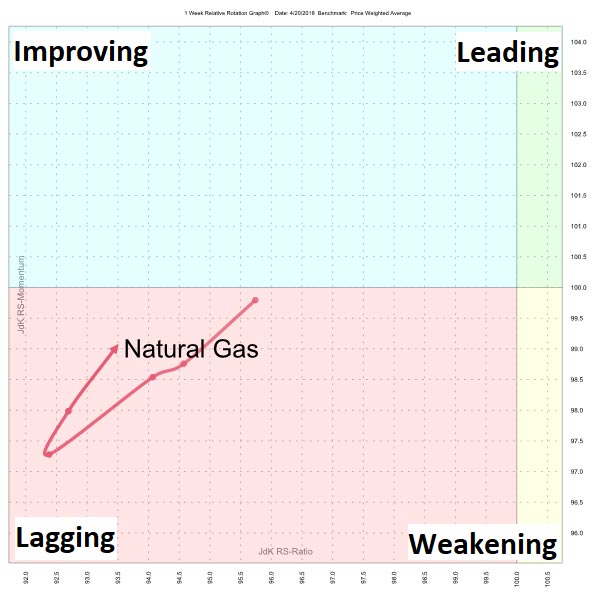
And we have natural gas giving a buy signal on a Relative Rotation Graph™ when compared to a basket of other commodities.
Take a look:

If you are unfamiliar with a Relative Rotation Graph™, just keep in mind the asset typically moves clockwise. It is in the lagging quadrant now, but is about to head into the improving quadrant, and then, most of the time, it continues to climb to the leading quadrant, and eventually weakening and lagging again.
The buy signal is when it turns higher in the lagging quadrant. This is a sign its underperformance, at least in the short term, is over, and prices are set to rally.
Each of these strategies do well in their own right — I know because I have tested them. But when you see them all in agreement on the direction for a stock or commodity, it is near perfect.
Regards,

Chad Shoop, CMT
Editor, Automatic Profits Alert


