
Typical investors ignore half the information available to them when they make buy-and-sell decisions.
Seems foolish, if you think about it. Professionals, after all, use all the available information.
Imagine if your doctor ignored half the data in your tests. It’s frightening to think what that would do. With just half the information, a mistaken diagnosis is possible. Or the doctor could completely miss a problem.
It’s not an exaggeration to say you could die if your doctor only reviewed half of your test results.
But if you’re an investor, odds are that you look at only half of the available information or less.
Why You Shouldn’t Ignore Time in Favor of Price
If you’re an active investor, you’ve probably seen price charts such as the one below:
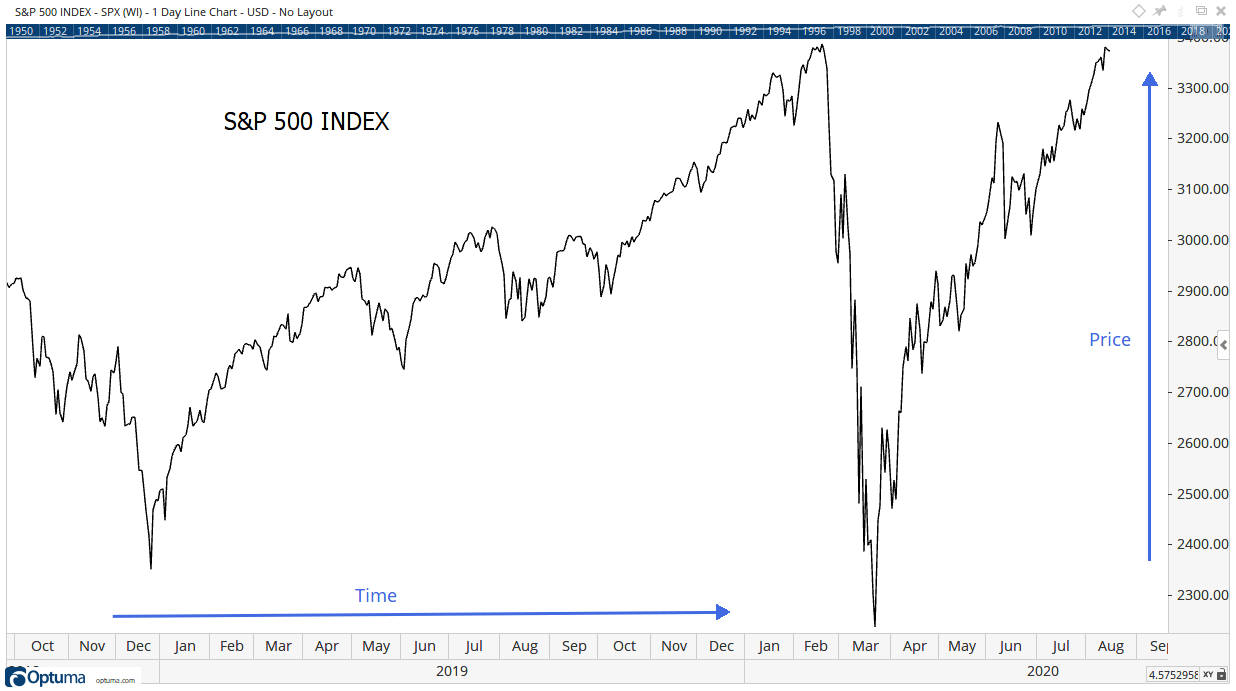
Investors tend to look at price. In this case, they may see the S&P 500 Index is back to its old high.
But many don’t consider time. That’s the horizontal axis in the chart.
In this chart, the time it took to recover from the decline seems short. In fact, it took about 100 trading days for the index to gain about 50%.
You might say that seems too fast to be sustainable.
History confirms this impression.
Standard & Poor’s 500 Index began calculating the index in 1957. Researchers recreated data back to 1928.
Since 1928, we’ve seen just a few times when there were 50% gains in 100 days.
One market move occurred in 1932, after Franklin Delano Roosevelt (FDR) was nominated for president. Another occurred in 1933, after FDR was inaugurated.
Those moves were caused by expectations that FDR would end the Great Depression.
Now, there’s no news to explain our current price move. The economy hasn’t recovered from the shutdown. There is no vaccine against the coronavirus.
There isn’t even a plan for recovery.
When we consider all the information on the chart — both price and time — we see that the recent price move is concerning. It seems to be too much, too fast.
That’s telling us that the rapid price action is unsustainable, and we may likely see a pullback in the market. Knowing this can help prepare us for our next trading decisions.
Examining the time required for a price move is just one way to use time in a market analysis.
Investors can also use time to develop profitable strategies. Among those strategies is my Strike Zone indicator. So far, it’s pinned down over 100 winning trades.
And I’m unveiling the ins and outs of it in my upcoming presentation this week. You can click here to reserve your free spot.
Regards,
Editor, One Trade