We often think institutional investors must be smart. After all, why else would firms give them billions of dollars to trade?
The truth is, they aren’t really that different than individual investors…
Some are smart. Others are of average intelligence…
Some are plain dim-witted.
You see, intelligence actually has nothing to do with being a great trader. And being a great trader isn’t always a requirement to trade at a large firm.
We can see the proof of that whenever there’s a steep sell-off…
The Predictable Playbook of Institutional Investors
Yesterday, the S&P 500 fell more than 2% in the morning. Institutional investors clearly weren’t prepared.
We know that because the Volatility Index (VIX) jumped almost 30%.
Take a look…
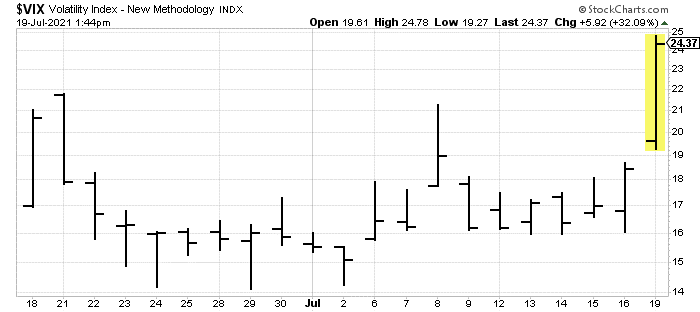
Source: StockCharts.com
(Click here to view larger image.)
This isn’t surprising. The VIX always makes a large move when the stock market sells off. That’s because the VIX is actually a formula that measures expected volatility over the next 30 days.
But what might surprise you is that move is caused by institutional investors.
Let me explain…
It’s important to understand that the VIX is a formula — not an asset like a stock. It’s not something you can trade directly. There is no such thing as a real unit of volatility, since volatility is a mathematical construct.
The formula for the VIX determines expected volatility by looking at the prices of options on S&P 500 futures. Since volatility can’t be directly measured, it is an estimate based on current prices.
Now, we know the VIX rises when prices fall. We also know from watching market action that option prices rise when prices fall.
Specifically, put options shoot up in value. That’s to be expected since puts increase in value when prices fall.
But the increase in put prices is always much greater than models indicate the gains should be. That’s because institutional investors are all trying to buy puts on S&P 500 futures when stock markets sell off. That drives up the prices of puts and that increases the value of VIX.
Since institutional investors are the ones most active in the S&P 500 futures markets, we know the VIX is driven by the institutional investors panicking. Most individuals don’t even have access to this market, and it’s probably true that most individuals aren’t qualified to trade in these markets under the exchange rules. Let alone know how to trade it.
Institutional investors rush to buy put options when prices fall to protect their portfolios. They don’t want to lose more than average, so they buy puts as a hedge. They generally aren’t trying to profit from the decline, just to offset losses in their core holdings. So they close the puts as soon as the panic subsides.
If these investors were really smarter than average, they wouldn’t behave this way and VIX wouldn’t spike on large down moves.
How to Counter-Trade the Institutions … and Profit
So how can we take advantage of this information?
If we know that institutional investors are piling into put options on index futures at the first sign of trouble, and that high volatility boosts put options prices, we could profit by being a seller of put options.
By selling put option premium, you would profit if the option expires out of the money. If the selling is short-lived, that makes this a profitable strategy.
This can be a risky strategy, of course, depending on how long the selling lasts. If prices continue falling and you sell put options too early, the prices will rise and you’ll be forced to buy back the puts at higher prices. There’s also no limit to how high these puts can go should volatility continue to rise.
A less risky approach is to buy ProShares Short VIX Short-Term Futures ETF (SVXY) calls.
This exchange-traded fund (ETF) moves in the opposite direction of VIX, so it should go up as the VIX retraces.
For example, the $50 calls expiring Friday (SVXY210723C00050000) are trading for about $1.70 at writing. If the VIX comes back down and stocks bounce, this trade could deliver a 100% gain by the end of the week.
Regards,

Michael Carr
Editor, One Trade
P.S. To get content like this in your inbox everyday, subscribe to True Options Masters. Click here and subscribe.
Chart of the Day:
Tesla’s Inflection Point
By Mike Merson, Managing Editor, True Options Masters

(Click here to view larger image.)
Tesla (NASDAQ: TSLA) is at a key inflection point.
The weekly chart of TSLA has been forming a symmetrical triangle pattern since the start of 2021. It’s one of the cleaner triangles I’ve seen in recent memory, with consistent candle and wick touches on both the resistance and support lines.
Symmetrical triangles can break one way or the other, and tend to do so with force. That makes them tricky to dissect on their own.
So, one would usually look to the momentum indicators like the moving average convergence divergence (MACD) and relative strength index (RSI) for clues. But there, too, we’re not getting much help. Both the MACD and RSI are almost perfectly neutral.
However, the MACD histogram, which charts the distance between the blue MACD line and the orange signal line, is showing gradually narrower distance. This suggests the MACD line could soon perform a bullish cross. We haven’t seen such a cross since November 2020 … when TSLA went on to double in price.
TSLA also has an earnings report on July 26. That could be just the catalyst the stock needs to break out of this pattern and potentially carry it to new highs.
Best,

Mike Merson
Managing Editor, True Options Masters