The CBOE Volatility Index (VIX) is a tool that can be used to measure the amount of fear in the S&P 500 Index.
It measures the level of hedging done by investors, so it goes up when people are anticipating the market going down.
The specific type of hedging that it measures is the buying of put options. Basically, the value of put options goes up when the S&P 500 goes down, and it’s a very popular way of hedging against losses. But when a lot of people are buying them, their value goes up, which in turn drives the VIX up.
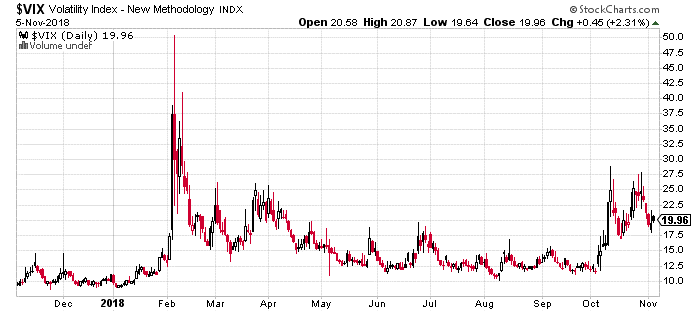
As you can see in the chart below, people were a lot more fearful when the market went down in February. After the market went up in almost a straight line in 2017, it was a huge shock when it fell by almost 10% in three days.
However, this time around, the market drop made a much lower impact on the VIX.

That means, in general, investors are less worried.
A similar pattern happened in 2015-2016. In August 2015, the market had a sudden sell-off. Then it rebounded, and fell again in early 2016.
However, the impact on the VIX in 2016 was much smaller. That suggests there was a higher expectation for the market to rebound.
Market Fear Is All Media Hype
Overall, the amount of fear in the market right now has been exaggerated by the media. That’s why during this market dip there’s not as big of a rise in the VIX.
This earnings season has seen 19% growth in corporate profits so far, and companies have been optimistic about future business.
Now that investors are seeing this growth, and hearing straight from management across every industry that business is booming, they’re less worried about hedging and more bullish on the market.
Regards,

Ian Dyer
Editor, Rapid Profit Trader


