
Stocks behave in different ways in different time frames. Studies show stocks trend sometimes and exhibit “mean-reverting behavior” at other times.
In the very long run, mean-reverting strategies work well.
If you’re a true long-term investor, a chart like the one below could tell where to look for investments. These are the worst performers for the past five years. After they stop falling, they’re likely to be the biggest winners in the next five years.
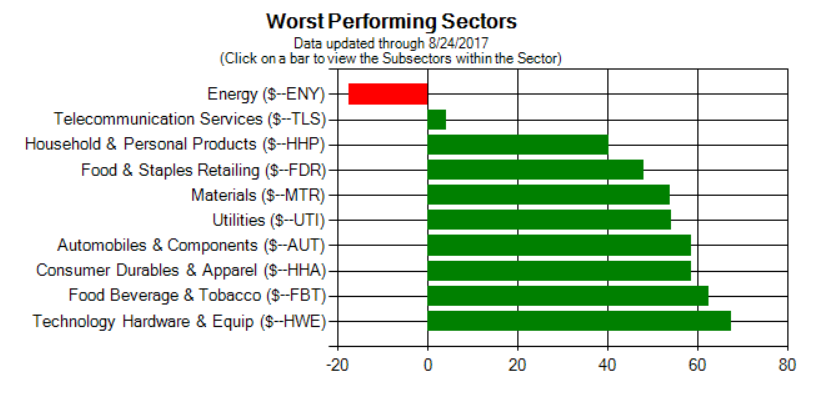
This kind of chart is the starting point for a mean-reversion strategy.
That’s the theory behind value investing. When a stock falls, if the business is good, the price-to-earnings (P/E) ratio falls. When the P/E ratio is low, the stock offers value. As the stock recovers, the P/E ratio rises.
The recovery pushed the P/E ratio toward the long-term average P/E ratio. In other words, the P/E ratio reverts to the mean.
As the price continues moving up, the P/E ratio should continue moving higher. After a few years, the stock should become overvalued. That would be the time to sell.
The key to success is waiting for the decline to end before buying. Momentum indicators can help time the bottom.
Right now, indicators like rising relative strength are pointing to the utilities sector as a buy. This is a long-term buy that could take years to pay off. But that’s the idea of value investing. It’s a long-term approach to the market.
Regards,
Michael Carr, CMT
Editor, Peak Velocity Trader