One of the hallmarks of an asset bubble is that investors increasingly rely on “faith and love” to justify their decisions.
Indeed, hanging on to promising stocks when they’re down is critical to long-term returns.
That’s why I always remind Bauman Letter readers to stay smart and tough. But the smart part is critical.
In today’s video, I look at recent market performance in the context of rapidly rising interest rate expectations to identify the stocks that justify faith and love … and those that don’t.
VIDEO TRANSCRIPT
Hey everyone. It’s Ted Bauman here, editor of the Bauman Daily and of The Bauman Letter. And if you want to subscribe to either, you can click on the link up above my left shoulder. That’ll give you the opportunity to take on a one-year opportunity to try out The Bauman Letter. You can get your money back anytime during that one year. And if you don’t like it, get your money back. If you do, you stick with us. You become part of a very rapidly growing group of people who are actually doing reasonably well. Of course, we do have some losers and today I’m going to talk about what makes them losers and where other losers might be found in the market. But before I do that, let’s just talk about some obvious facts.
Here is a chart that shows a 10-year look at the 10-year Treasury yield. In other words, this is the last decade’s worth of yields on the 10-year Treasury bond.
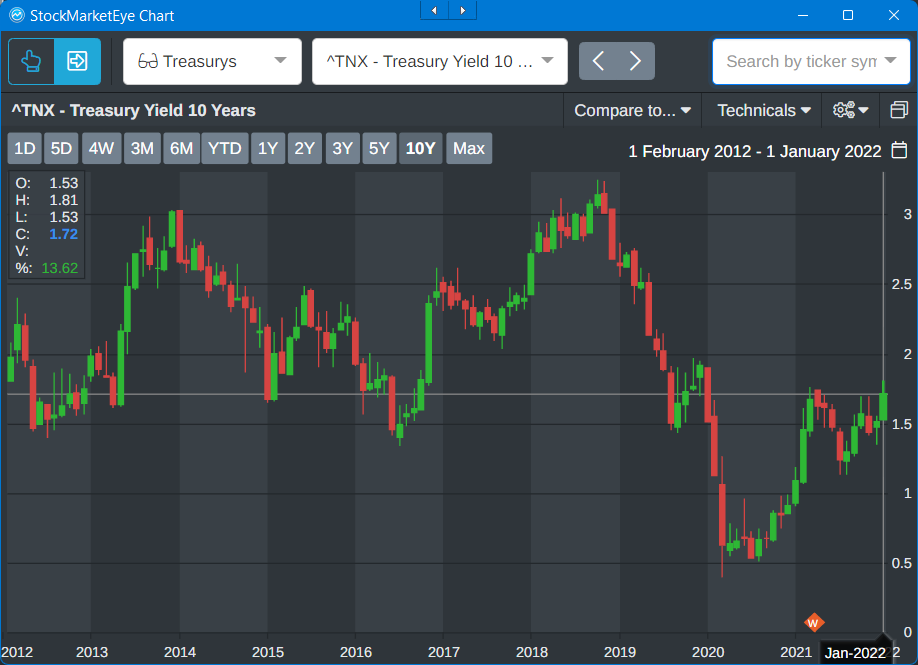
Now, right now, if you look at the middle on the right-hand side, you can see that the 10-year is peaking above its earlier peak that it reached in February, April this year. And that seems to be a trigger for a lot of selling. And although there’s been some value dip buying lately, there’s been all kinds of ups and downs in the market. One of the critical things that I’m going to show you is that a certain type of stock doesn’t like interest rate rates that get up to that level.
But here’s the critical thing. Look at this chart. We are at the lower end of where interest rates were between 2012 and 2019, aren’t we? Essentially interest rates tried to get up in 2013. That’s when chairman Ben Bernanke of the Fed tried to slow down the purchase of assets and raise interest rates. There was a tantrum in the bond market and then the Fed backed off that. They tried again, kind of back and forth between 2015, 2017 and then Chairman Powell came in, appointed by President Trump and tried to raise interest rates. That was his instinct and the end of 2018 he said basically, “We’re a long way from a neutral interest rate,” sending the message that the Fed was going to raise.
And then all throughout 2018 and 2019, the markets really didn’t like that. And then at the end of 2019 Powell capitulated and began to allow rates to fall. Basically, for a couple reasons. One is that he was getting a lot of stick from the bond market and from falling equity values but he also was worried about unemployment. And then yields started to rise at the end of 2019 but then COVID happened, as you can see.
The point I’m making here is that right now, all the hoo-ha about interest rates really relates to rates that are historically, even over the last decade, which has seen a really long-term bull market in the stock market are still at historically low levels. Why the big deal about interest rates? Well, a lot of you know the answer, but it really comes down to what’s called duration. Now duration in bond markets is fairly straightforward. Duration is the length of time until the bond reaches maturity and all other things being equal, long duration bonds have higher yields because of the extra risk associated with what might happen over a long period of time. Now that’s not always the case but basically, duration is a measure of risk because anything that you expect to happen far out in the future can be influenced by a lot of different things.
And the stock market duration measures the length of time required for cash flows from stocks to be realized. Now, in the case of stocks that have long duration, those are equities that are expected to deliver a higher proportion of their 10-year cash flows in the distant future. In other words, a long duration stock is one that is very sensitive to the risk of events that might happen between now and the long future. By contrast, short duration stocks are equities that are expected to deliver a higher proportion of their cash flows in the near future. Now, why is this important? Well, the basic maths are that the further out your cash flow returns are expected to be, the more risky they are and also the more sensitive they are to rises in interest rates and inflation, both of which discount the future earnings at a higher rate.
In other words, if you’re expecting a $100 in income in 10 years and interest rates double then basically you have to mark down that a $100 to a much lower value today because the interest that you could earn by putting that $100 elsewhere is a lot higher than it was in the past. When you compare those two things, a $100 in 10 years versus a $100 now with the interest rate that you could earn, higher the interest rate, the lower the value of the future stock and therefore the stock price falls when interest rates go up. By contrast, short duration stocks tend to be a lot more isolated or protected from interest rates unless the interest rates can squeeze a company’s margins. That’s a different story for another day.
But let’s look at one of the most famous long duration assets in the U.S. stock market today and that is the ARK Innovation ETF (NYSE: ARKK). Now here’s a chart that shows ARKK’s performance over the last two years, going back to 2020 and then basically falling off a cliff in late February, early March last year, 2021.
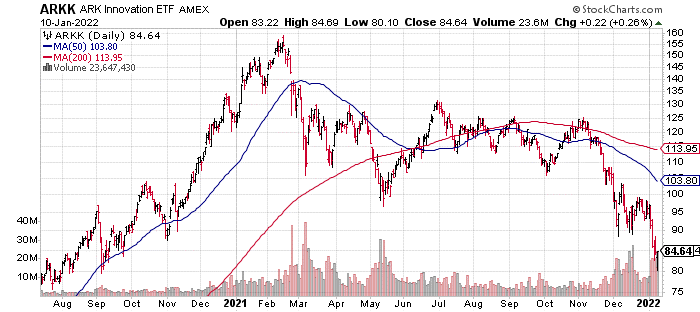
Why did it do that? Well, because interest rates and there was an expectation that interest rates were going to rise because inflation was starting to hit high levels. Clearly you can see that there’s huge sensitivity, even though it wasn’t guaranteed that interest rates were going to rise. The Fed didn’t say they were going to do that. All these long duration stocks that were held in ARKK, Cathie Wood’s flagship product took a serious beating. They fell by something like, I’m just kind of looking over the kind of 60% kind of decline.
Now, ARKK traded sideways for a lot of the year, there was another scare in May but then it recovered pretty quickly and it’s been trading up and down. But look what happened since late November. It’s really fallen off a cliff and now its valuation is back to where it was really kind of late 2020. Now, you’ll see she still made a big gain but the bottom line here is that something happened towards the end of November that led to a big decline in interest or in the value of her holdings. And that was of course, the Fed starting to talk tough in a hawkish way.
Here’s another ARKK product, ARKW which is its internet portfolio, a little bit less interest rate sensitive than it has been:
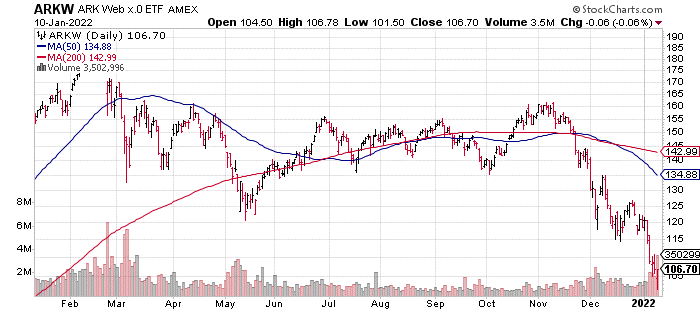
This is just during the course of this year. But again, you can see the same dynamic. That after trading sideways for most of the year after February, March, when it had that initial decline, it’s really just fallen off a cliff. It’s basically way lower than it was at the beginning of the year. If you bought this at the beginning of the year, you’ve lost a lot of money.
Now here’s a chart that overlays ARKK in black, against the 10-year interest rate yield, that’s the TNX symbol:
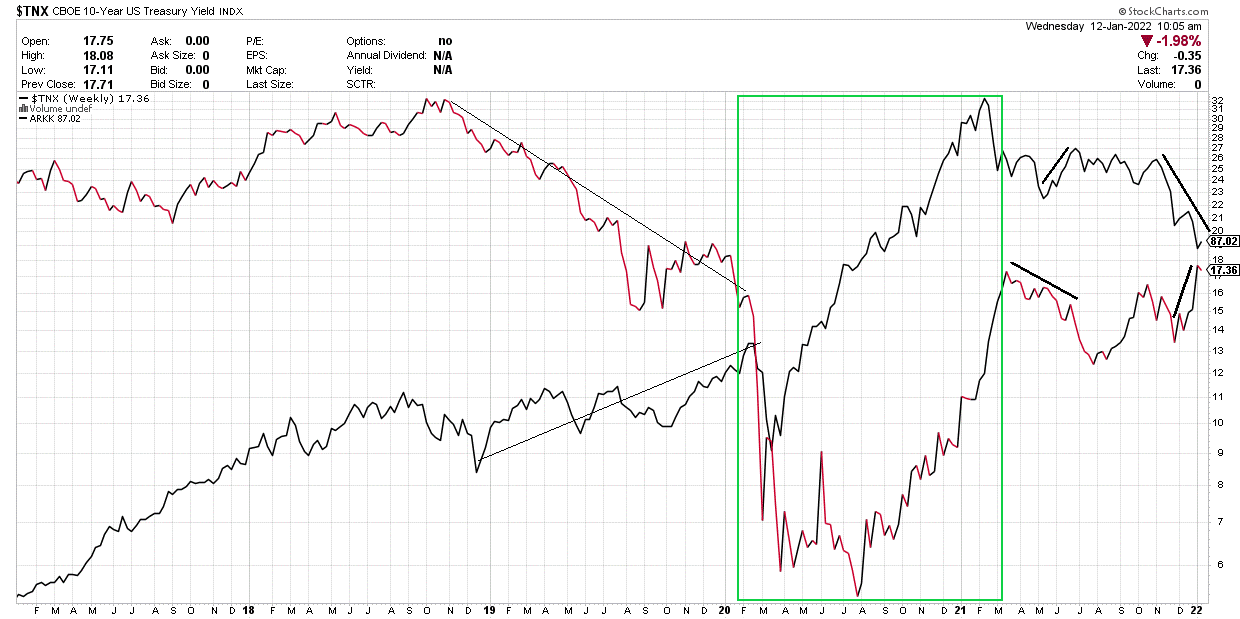
The 10-year interest rate yield is the top line, ARKK is the bottom line. Now I’ve tried to annotate this to illustrate the sensitivity of ARKK’s holdings and therefore to its own “price to interest rate” moves. Now, when Cathie first started her products, the interest rate environment was fairly stable. There was a good story to be told in 2017 about stocks of that type, these long-duration, high tech future stocks that were going to change the world. And so they rose. Then interest rates started to rise but ARKK continued to rise as well.
There was a little bit of a dip at the beginning of February, beginning of 2018, but overall, the fund continued to grow, albeit at a slightly slower rate as interest rates rose. But then look what happened. The end of 2018 when basically Powell blinked and agreed to suspend the tapering of the Fed’s balance sheet and backed off on raising interest rates. You can see I’ve drawn a line showing how rapidly interest rates fell and then I’ve drawn another line below to show how rapidly ARKK began to rise in response. Clearly when interest rates fell, ARKK got a big Philip.
Now the green box, the green box shows two things: One, is a collapse of interest rates as the Fed reduced short-term interbank rates basically to zero. And secondly, the massive infusion of liquidity into markets as they were trying to combat the fears that people were starting to have about COVID and what it could do to bond markets and particularly corporate credit markets. Now, the key thing here is that you have two different effects working at the same time and it’s important to distinguish them. One is the fallen interest rates but the other is just this massive increase in liquidity. All other things being equal, if the Fed is buying lots of Treasury bonds and mortgage backed securities out of the market, that means that banks have a lot more money to make available to things like margin accounts, to use their own trading accounts to buy on credit. In other words, to buy stocks on credit and all of that liquidity plus the low interest rates helped ARKK to soar dramatically up until February, March last year.
Now, then we see the 10-year beginning to drop at the beginning of 2021, during that March, April, May. And again, I’ve shown a little line showing that ARKK responded positively. As the 10-year yields fell, ARKK began to recover, then it traded sideways. Then look what happened again, as I’ve described before, big fall off in ARKK accompanied by a big rise in interest rates, as I’ve indicated there. Now here’s the really funny thing about all of this. A lot of people say, “Well, the issue here is that you got to hang on to these stocks. They’re the stocks of the future. You’re going to basically miss out if you don’t hang on to these stocks. You’ve got to have faith. You’ve got to basically love these stocks and never let them go.”
Well, here’s the problem.
There’s a couple of different ways you can look at this but one of the biggest issues facing a fund like ARKK is that it is based on faith. You have to believe that these companies, no matter what their current performance, no matter what their current price levels are, their valuations, that they are the future and that therefore, you really want to make sure that you hang on to those stocks and not miss out on future gains or maybe even double down. Well, here’s a big challenge to that view. Here’s a chart that shows insider transactions in stocks held at ARKK:
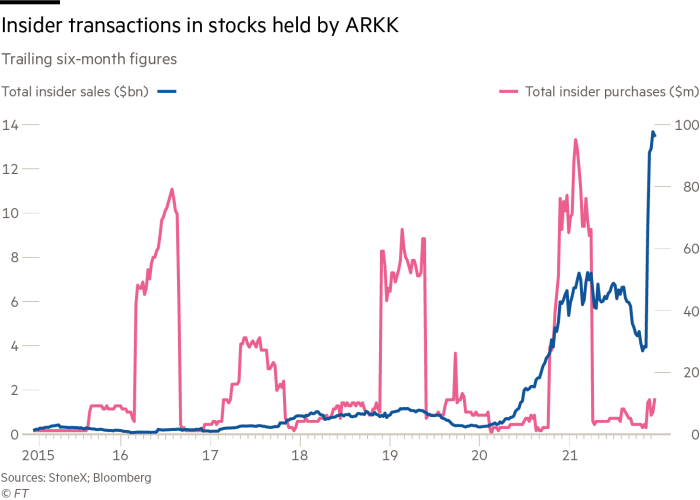
These are trailing six-month figures but they basically show total insider sales and total insider purchases. I don’t think I need to tell you the story too. Basically, we’ve seen a lot of purchases at certain points in time but starting in late 2020, picking up dramatically in the last couple of months, we’ve just seen huge insiders’ sales. These are the people who run the companies held by ARKK. They are bailing on their own stocks. Why are they doing that? Well, I would argue that it is because precisely what I showed you earlier, that these higher interest rates mean that the future value of these companies’ earnings is falling. And therefore that means that all other things being equal, once you get through the faith part of what’s going on in the stock market, in other words, the strong hands, I’m not going to sell, whatever. Once you get past that, the pure mechanics of valuation is going to start to put downward pressure on these stocks. And so these guys and these girls who own these stocks at the companies themselves are starting to sell.
Now, here’s one of the most shocking things about this. If you bought ARKK at the very, very beginning, yes, you’ve made money. You’ve definitely recovered, you’ve enjoyed big gains, even though there’s been big pullback. I get people writing to me all the time, making fun of me because I always use ARKK as an example of in a sense, the irrational exuberance in some parts of the stock market. But if you look at it from the perspective of value creation, in other words, the actual value that stockholders have gotten from this vehicle of Cathie Wood’s ARKK, basically anybody who bought this vehicle after let’s say about October or November of 2020, has basically lost their shirts. And they have lost money big time. And a lot of people did buy those things at that time because they were going up.
Now, I bought stocks for The Bauman Letter at that time, that kind of fall into the same category and they’re down big time. And so I’m going through this process that I’m describing to you with my own portfolio that I’m saying, “Hey, which one of these stocks are going to recover? Which aren’t?” But here’s another big factor:
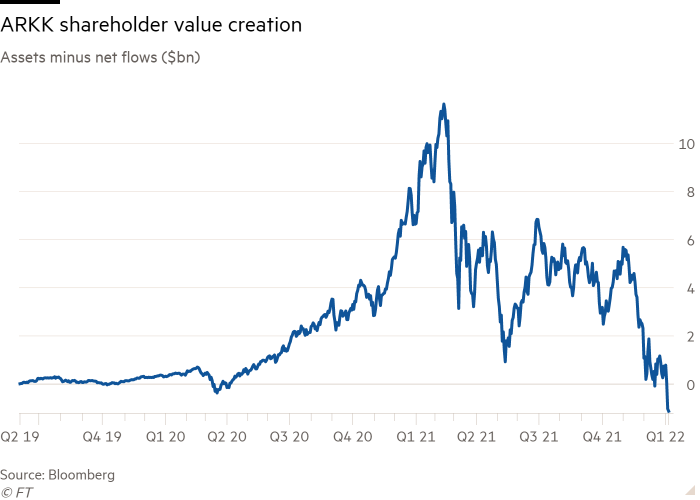
Look at the relationship between assets minus net flows, in other words, money coming into ARKK and money going out of ARKK. In other words, you’ve got the value of the stocks that are held by ARKK, minus the amounts that people are withdrawing from it. Well, right now, ARKK’s net value creation, in other words, the amount of money that has flowed out of the fund, the ETF, plus the decline in assets has basically brought it back to the point where the net value creation in that fund has reached zero.
Now again, I’m not on a vendetta against ARKK. And I know people are going to write in the comments, you’re going to say, “I’m an old fuddy duddy, and I don’t get it.” And all this kind of stuff. What I’m trying to say is, sure, these companies have great prospects. I invest in some of these companies, but there’s a question you’ve got to ask yourself, which ones? Which ones do you invest in now under these circumstances versus the ones that are just not going to recover that are going to get slapped down? Well, here’s a way that I want to address this issue. This is a list of positions held in one of my products at Banyan Hill, which is under my name. I’m not going to give the name of the product. I’m not going to give the tickers but I just want to show the relationship between two things.
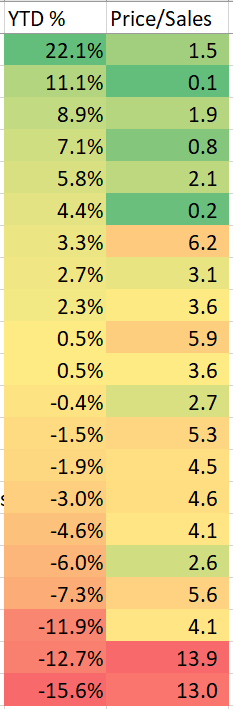
One is their year-to-date gains and the other is their price-to-sales ratios. Now price to sales is basically the current price of the stock divided by its future earnings per share over the next 12 months. All other things being equal, if you have a very, very high price to sales, it means you’re paying a great deal of money for revenue that is not going to be all that great. And I’ve color coded this to show how close the fit is. The highest grossing stocks, the stocks that have had the best gains this year at the top of the ladder, tend to be stocks that have very low price to sales. In other words, their current stock price relative to their future earnings is very low. At the other hand on the very bottom of this list, the ones that are in negative territory, you see it gets yellower and yellower and yellower until you finally get down to red. And those are the stocks that have had the biggest, big drop in their price.
Now there’s not a one to one correspondence because you can see some high price to sales for companies but have reasonably good year to date gains. And that’s because a company is different. Every company has different trajectories, they have different guidance, they have different analyst estimates, there’s acquisitions to consider. There’s all kinds of things. New products get launched. All these things can make a big difference. The bottom line is that right now in the increasing interest rate scenario that we’re facing, it’s clear that of stocks that give you more revenue quicker at a lower price are the ones that are getting the rewards.
Now let’s apply this same approach to ARKK, to Cathie Wood’s flagship product and let’s look at the performance year to date of her stocks. This is the top 50% holdings. It’s not everything in ARKK but it is the top 50%.
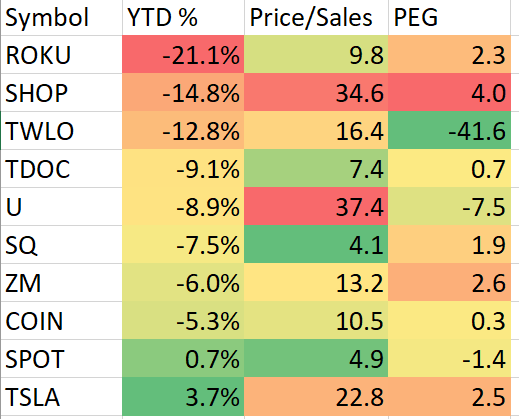
Now Tesla’s a bit of an outlier, Tesla as we know, can get away with practically anything and still see its stock price go up because it is the ultimate faith stock. It’s the stock people fall in love with Tesla and that’s it. They become Tesla fans, nothing can change their view. That’s not the only reason Tesla had great sales in the last quarter and they did that because they were able to adjust their own software, to give them flexibility to use different chips. If the ones they initially wrote their software for weren’t available, they were able to rewrite that software quickly because they do that in house. Good for you, Elon. That’s a good plan.
But let’s look at the relationship between the year-to-date gains, price-to-sales and PEG ratios. PEG is basically your price to earnings ratio divided by the rate of earnings growth over the next 12 months. Now the norm is that a PEG ratio over 1 is considered to be overpriced. You’re paying too much for growth. If you see a negative figure like you do for Twilio or for Unity Software or for Spotify, that means that earnings are actually slowing and they’re negative. Basically, you have negative growth. Even though that one’s green, it’s just because that’s the way Excel spits out this stuff so ignore that. But basically again, you see a similar pattern. At the top, you tend to see high price to sales and high PEG ratios. Shopify, for example, that’s just a price to sales of 34.6, which is absurd. It means that you’re going to take more than 34 years to justify the dollar that you spend on a dollar worth of future earnings for this company. And that’s assuming that it pays no taxes and has no costs.
There was a famous quote from back in the dot-com bust when a guy, I think it was from Cisco, who said, “What were you guys thinking when you paid 20 times forward earnings for my stock? You knew you were never going to get your money back so you were paying too much. You were crazy and you lost your shirts.” But on top of that for Shopify, you’ve also got a PEG ratio of 4, which means that’s just not fast enough to justify that. And so what we’re seeing in this high interest rate environment is it’s getting murdered. Now Roku’s got better figures but they’re still not acceptable to the market. And there’s some other idiosyncratic reasons I think why Roku’s declining. A lot of it has to do with competition from other streaming services. But the general pattern here is that the only stocks that are actually beginning to see a little bit of upward momentum are those that have, or rather less downward momentum I guess you could say, are those that have relatively more reasonable price-to-sales ratios but also more reasonable PEG ratios. Not an exact fit but the pattern is there.
What does this mean? It means that in 2020, the game plan has got to be that you look for fairly priced companies that have near-term realistic earnings. Now that doesn’t mean you should sell your holdings in these stocks. And in some cases, certainly if I were holding Teladoc or a company like let’s say Tesla even, I’d probably add more to that position for different reasons. But basically, Teladoc for example, has a reasonable price-to-sales ratio of 7.4. That’s lower than 10, which is considered the upper bound of reasonability, and a PEG ratio of 0.7. That means that Teladoc alone out of that group has actually got reasonably rapidly growing revenues. And that’s the one I’d buy. The other’s not so much. I think I’d wait to see what happens.
But here’s a chart that shows the relationship between two ETFs:
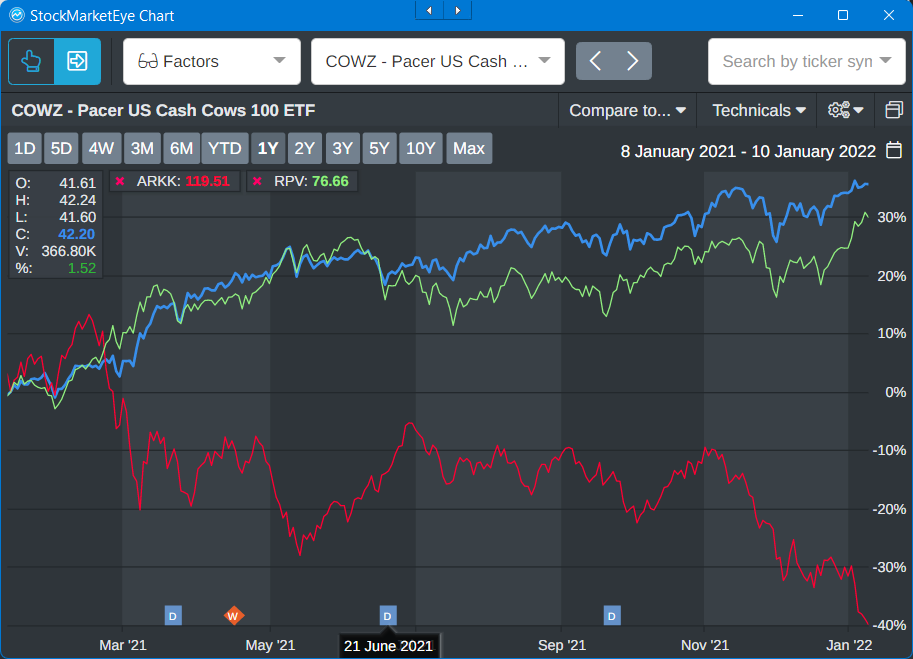
One is the Pacer U.S. Cash Cows ETF and the other one is RPV, which is a value-based ETF, which both companies hold companies that generate lots of near-term visible earnings and are less affected by interest rates and also are underpriced relative to their earnings growth. Basically those stocks in that category have beat the Cathie Wood’s model by 70% over the last year, 70%. If you had bought those ETFs or companies in those ETFs a year ago, you would’ve earned 70% more than if you had stuck with your faith and love approach and held on to ARKK.
Now, I’m not saying that you should have sold ARKK but maybe taking a little bit off the table and reallocating, it might have been a good idea. Which is what I’ve been doing at The Bauman Letter all year. Basically, after February and May, we decided to move into companies producing visible short-term earnings and at reasonable valuations and those are the ones that have done best for us this year. Now, all this means is that going forward this year, you’ve got to pay attention to what’s likely to happen. Goldman Sachs went from saying three interest rate hikes this year and Fed selling of reverse quantitative tightening, basically starting in the fourth quarter to four interest rate hikes and the potential for selling off of the Fed’s assets starting in the second quarter. And that means that that is a much, much more rapidly rising interest rate environment than a lot of people had expected. That’s why these stocks are getting killed.
The bottom line is you’ve got to wait until that works its way out before you make decisions as to what to buy or double down on. It can’t just be about faith in the future right now. You’ve got to pay attention to the fundamentals and that’s my message for you this week.
Ted Bauman signing off. I’ll see you again next week.
Kind regards,

Ted Bauman
Editor, The Bauman Letter