It’s no secret that tech stocks have led the latest volatility we have seen in the market.
The Nasdaq 100, made up of mostly tech companies, has slid 7.5% over the past few weeks.
If you’re like me, you’ve been waiting for the perfect opportunity to load up on these beaten down companies and ride them higher over the next few weeks.
Well, my friends, that time has come.
Based on the Relative Rotation Graph, which combines the two most powerful technical indicators in the market — relative strength and momentum — tech stocks are about to rip higher.
Let me show you…
I’m Calling a Bottom
Here’s where the Technology Select Sector SPDR Fund (NYSE: XLK), a popular tech ETF, sits on the weekly Relative Rotation Graph…
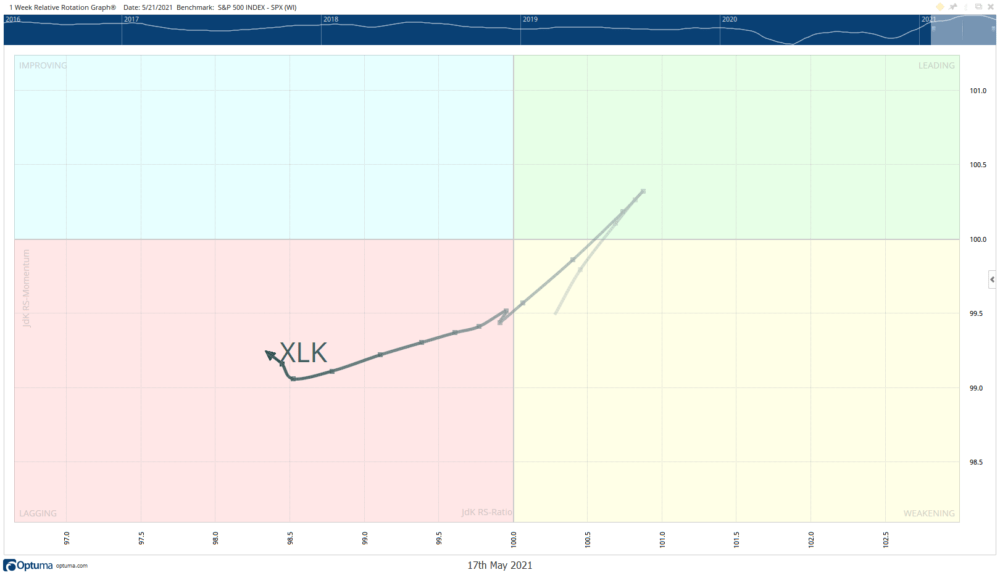
Each dot represents one week on the weekly graph.
As you can see, tech was in the green leading quadrant, then fell sharply into the yellow weakening section.
Now, it’s firmly in the red, or lagging quadrant at the bottom left of the chart.
That means it hasn’t kept pace with the overall S&P 500 ETF. Tech stocks have been hammered and that helped push the XLK ETF into the lagging quadrant.
Nowhere Left to Go But Up
But, where there’s pain, there’s room for gains.
As you might be able to notice, XLK is rounding the corner.
Which makes sense. When something is oversold, it has nowhere to go but up, typically. The RRG helps us monitor these overbought and oversold conditions without having to “guess” based on what we see in a price chart.
I’ve studied the RRG for years now, and one of the best ways to use it is to spot turning points in the lagging quadrant — which is exactly what we are seeing happen with XLK.
It typically takes eight weeks for a sector to move from the lagging to leading quadrant. That means the gains over the next eight weeks could be absolutely phenomenal.
Tech Is Barreling Higher
When we look at the Daily RRG, the case is even stronger.
Just look at where the daily RRG has the XLK today…
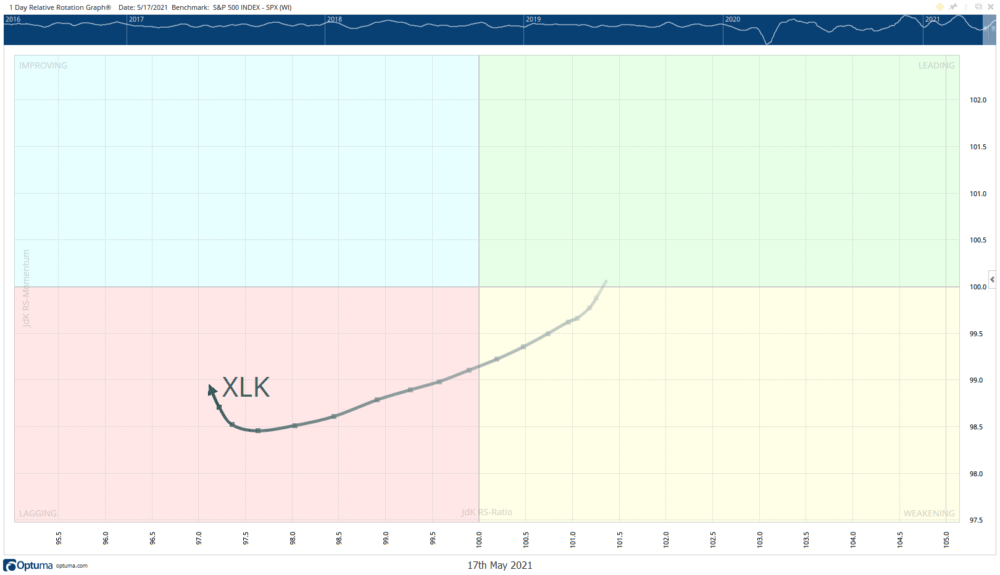
It’s identical to the weekly RRG … and actually a bit stronger. As you can see, it’s racing toward the blue improving quadrant.
As the tech sector turns higher on the daily RRG, this signals gains are ahead for the sector over the next couple of weeks. It comes at the exact same time the XLK is trending higher on the weekly RRG.
I love it when different time-periods line up perfectly. Two different time frames both throwing off buy signals gives me greater confirmation in the rotation we are seeing.
That gives us two reasons on two different time frames to make a bullish trade on tech stocks right now.
And I’m ready to jump in.
4 Stocks to Watch
If you need some trading ideas, the RRG can help with that too.
Here’s a few stocks to keep on your radar:
Citrix Systems (Nasdaq: CTXS), First Solar (Nasdaq: FSLR), Skyworks Solutions (Nasdaq: SWKS), and Qorvo (Nasdaq: QRVO) are at the top of my list right now.
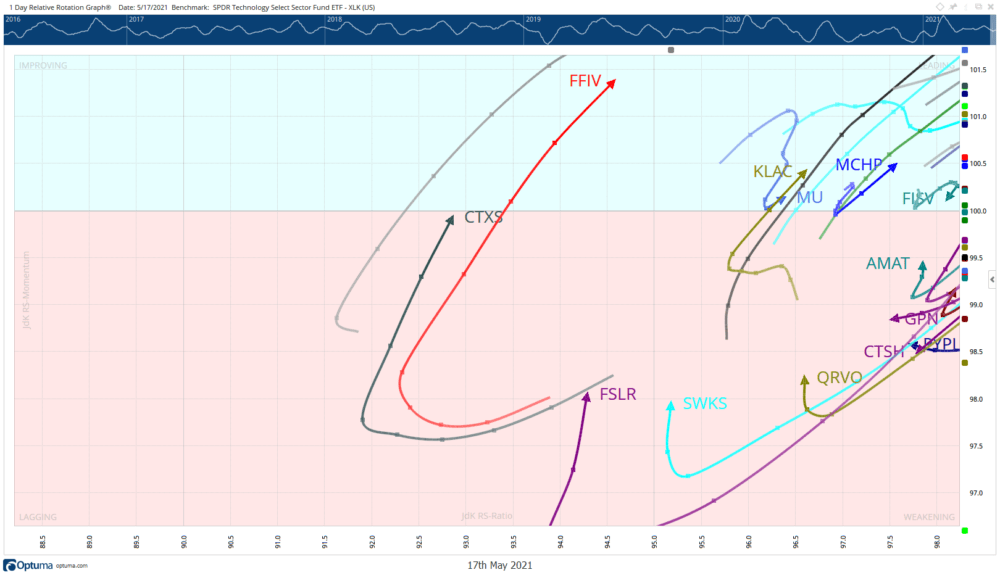
These are right out of the XLK ETF holdings and you can see they are making that same turn higher.
Remember, RRG shows us clear cycles in the market. Tech is in the lagging quadrant, but it’s clear set to head into the improving quadrant then lead the market once again.
Again, it can take about eight weeks for a sector on the RRG to move from lagging to leading. That means if you choose to trade these stocks, you may want to select options with a two-to-three-month expiration.
Keep these stocks on your watchlist for quick profits in the tech sector.
Regards,

Chad Shoop
Editor, Quick Hit Profits
P.S. To get content like this in your inbox everyday, subscribe to True Options Masters. Click here and subscribe.