Most major stock market averages are trading near all-time highs. Indexes of large-cap stocks show strong uptrends. For at least the next couple months, new record highs in the large-cap indexes seem likely.
If you ask me, though, it’s a bit boring.
These indexes are unlikely to produce extraordinary returns in the months ahead.
Right now I’m attracted to sectors providing far greater setups. Charts with less obvious trends. Areas of the market investors have come to ignore.
Why?
Because that’s often when they start to surprise us…
Small-cap indexes, for example, offer a far more interesting chart right now.
Let’s take a look at the iShares Russell 2000 ETF (NYSE: IWM)…
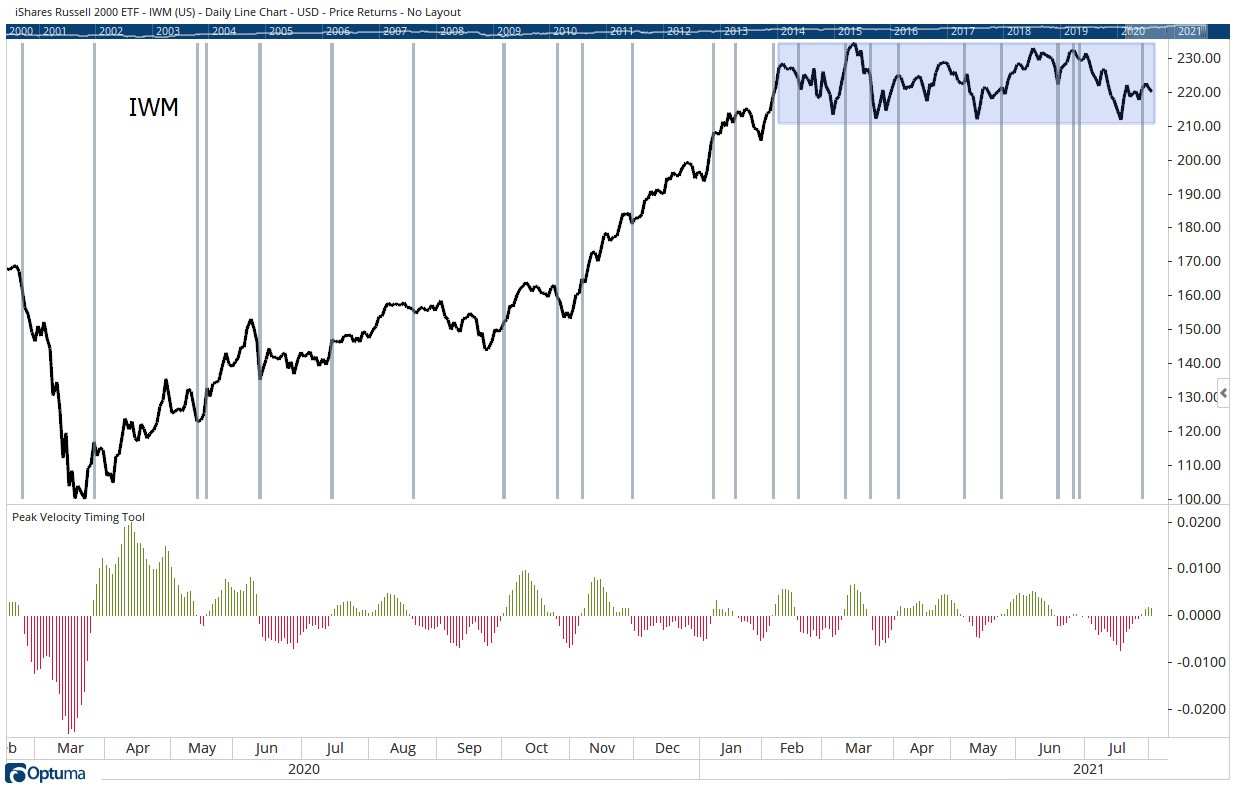
(Click here to view larger image.)
IWM is the largest small-cap exchange-traded fund (ETF) in the market. It’s spent the year generally frustrating everyone who’s traded it.
The rally stalled in January and hasn’t made a new all-time high in almost six months. It’s spent the entire time just chopping around between $210 and $232.
This price pattern actually has a name. Traders this year might like to call it a “headache” pattern, but it’s actually known as a rectangle.
Traders recognized the importance of rectangles all the way back in the late 1800s. At that time, Charles Dow, the founder of The Wall Street Journal and developer of Dow Jones averages, called the pattern a “line.” He believed it was a bullish pattern.
Dow theorized that the market moved in waves. An up move would be followed by a small down move and the pattern repeated until the direction of the major trend reversed.
He explained this was like the waves on a beach — with each wave moving further inland until high tide was reached.
Occasionally, Dow noticed the market didn’t pull back as expected. Instead of declining, prices moved sideways. This was his “line” pattern, and he explained a line could replace a pullback.
The line gave fundamentals time to catch up with the price action and set up a renewed uptrend. Traders today would call this a “consolidation” pattern within a rectangle.
Regular readers of mine know I use an indicator I invented, the Peak Velocity Timing Tool, to confirm uptrends and downtrends. It’s also helpful in predicting when and how those trends could change in the short term.
The Timing Tool is based on the very simple idea that prices move higher in uptrends and prices fall in downtrends. I defined a mathematical relationship to identify the direction of the trend based on the strength of the price action. The formula is designed to respond quickly when the trend begins.
Late last week, the Timing Tool flipped from bearish to bullish. Crossovers from bearish to bullish and vice versa often precede large price moves.
For now, it appears the path of least resistance in IWM is up. There is resistance at its all-time high near $232, about 4% above the current price.
Call options could be attractive for this opportunity. Calls expiring on August 27 with a strike price of $222 (IWM210827C00222000) are trading at about $5. If IWM reaches $232 this month, that call would deliver a gain of at least 100%.
What’s great about this trade is we aren’t even looking for IWM to break out to new highs. Only for it to revisit the top of the rectangle it’s been stuck in all year.
If it escapes the rectangle, that’s even more bullish for the broad stock market.
Regards,
Michael Carr
Editor, One Trade
Chart of the Day:
New Highs Ahead for TSLA?
By Mike Merson, Managing Editor, True Options Masters

(Click here to view larger image.)
Today we’re checking in on the chart of Tesla (NASDAQ: TSLA).
I shared this chart with you back on July 20, pointing out that TSLA was forming a classic symmetrical triangle pattern. I suggested that, due to TSLA’s bullish MACD histogram and upcoming earnings announcement, that we’d likely see the stock break out of this triangle to the upside.
Fast-forward to now, and that call proved accurate. TSLA has broken out.
But what lies ahead for the king of electric vehicles?
There’s no way to tell for certain. But looking at a recent, similar pattern that occurred in late November 2020, we can see that TSLA went on to set new highs after breaking this pattern.
It’s important to note, however, that TSLA came back down to test the resistance line as support before running higher. For me to be more confident in this breakout over the longer term, that’s what I’d like to see happen here, too.
For my money, any weakness in TSLA should be seen as a buying opportunity, so long as it doesn’t break back through the former resistance line at the $660 level.
Regards,

Mike Merson
Managing Editor, True Options Masters