
Last week, we saw a lot of doom and gloom surrounding inflation, the Federal Reserve’s recent rate hikes and our entry into bear market territory.
But what if I told you the market’s plunge could actually be a path toward quick profits?
Today, I’ll be revealing two factors to spot weak stocks and when/how to play the downside.
Click here to watch this week’s video or click on the image below:
Transcript
Hey everyone, Clint Lee here with a special video update.
Now look last week, the S&P 500 officially plunged in the bear market territory. But look, the reality is that the average stock has been in a bear for some time now. And with inflation getting worse, we have a growing energy crisis. We saw the Fed is getting more aggressive on rate hikes. It’s a scary time for investors. That’s why today I wanted to share a strategy I’ve been using this year to profit on the downside and specifically how I’m using quantitative factors in analysis to determine when to deploy my strategy and then beat the bear. But before we get started, I want to let you know that Ted and I, we just released a special episode of Your Money Matters about using powerful quant factors that you could be using to boost your portfolio. It ran a little longer than our usual videos, but I think it’s an absolute must see for anyone who wants a way to navigate this bear market.
Just click on the link in the description to check it out, and you’re going to want to check it out right away. So feel free. Pause me right here. Click on the link below to get started. Now for today, I want to share a few ways that I’m using some of these quant factors and things that impact quant money flows to make gains on the downside in this market. And one simple way to play the downside is with put options. A put option gives you the right to sell at a specified strike price. So if a stock price falls below that strike, which means it’s giving you the right to sell at a price that’s higher than the market price, then that option contract can see gains in its value. Sometimes those gains can come quick. That’s because the saying that stocks that go up on an escalator and down on an elevator, meaning the downside news can happen quick.
And we’ve seen that over these last two weeks now. So I want to share one metric I use to tell me when to start looking at put options and then a couple quant factors to tell me what stocks could be leading the way lower here, making them a prime target for a put trade. So with that, let’s just dive right into it. So first, when to look at puts, this is probably the hardest part of a put trade, and that’s trying to assess the potential for downside in the stock market. Now you can still have scenarios where an index like the S&P 500 is marching higher, and you can still find individual stocks that are falling. But I like to stack as many variables as I can in my favor. So in this case, I want to look at the potential.
I want to gauge the potential for a falling market to enter a put trade. Now, I look at a lot of different things to assess the stock market’s direction over the near term, which for me near term means a few months out. And one of those things I track that can influence movement and trillions, there’s trillions of dollars in fund flows. And that is with stock market volatility. And look that’s because there are all sorts of strategies that use volatility to manage how much exposure they have to the stock market. There are quant funds, there’s something called risk parity funds, but the similarity is that they target a certain level of volatility in our portfolio. I like to think of it as it’s like having your risk budget. You probably have a spending budget. If you go over your budget, you cut back on spending. If these funds start to see stock market risk go over their budget, they cut back on how much stocks they hold.
So a pickup in volatility can become sort of this feedback loop because it leads to selling, selling leads to higher volatility and so on and so on we go. So one simple metric I watch for a pickup and volatility is just with the VIX index. This measures the expected volatility in the S&P 500. And look, this might be the most mean reverting thing I know of, meaning it tends to snap back from extreme levels, whether it’s extremely high levels or extremely low levels. Now if you look at this index around 20 is the long term average on the VIX. So what I do is I watch for a move over 20 from a low reading. So let me show you a three year chart right here of the VIX to put things into perspective:
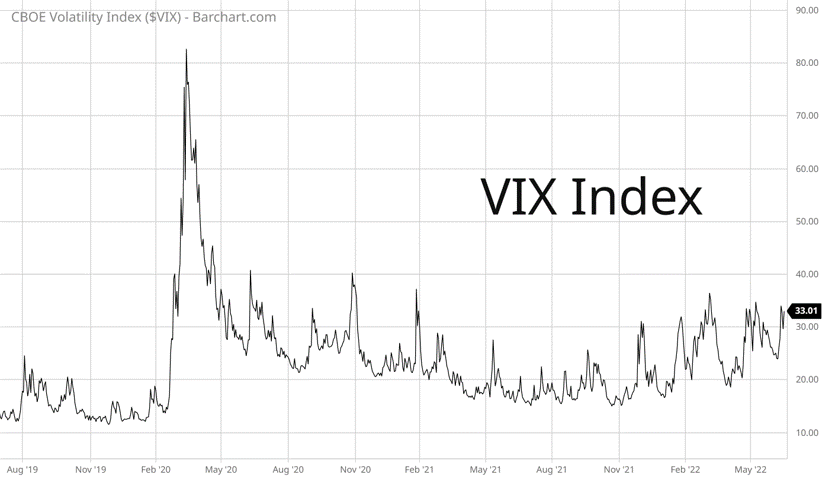
So here’s that chart. This period right here in 2021, I mean this was a low volatility regime, so not much going on in terms of me looking at the put side, but look at what’s happened since November, 2021. Now we’ve entered a higher vol regime, a sustained move over this 20 level. Once again, it’s the long term average, a sustained move over 20. You can see these higher lows right here that keep coming into play. Each time the VIX has come back down then to about this 20 level and turned higher, that’s what’s had me on the lookout for new put opportunities.
So once I’m on the lookout for buying a put option, what stocks should I target? This is where I turn to specific quant factors to spot the best opportunities. Now, in the case of puts, I want to find stocks that rank poorly based on my factors and could go on to see further price declines. So let me give you a couple examples of what I’m looking for, especially right now in this environment. So first one I’m looking at is with momentum factors. Momentum factors are one way I can quickly zero in on weak stocks and I’m looking for weak price action. Momentum’s just a way to rank stocks based on their past returns, looking at things like the previous 6- or 12-month returns. And I do this because price trends over those timeframes tend to persist. That can be on the upside and the downside.
So when the stock market is declining, I am not trying to find a stock that’s seen huge gains and I’m trying to pinpoint its top. I’m looking at names that have already been leading on the downside. And quite honestly, a lot of times the names I’m looking at based on these momentum metrics are on the verge of making 52 week new lows. Now there’s another factor category that I’m singling out once again, especially in this market, and that is with credit factors. Credit factors evaluate the likelihood that a company could default on its debt. And it looks at things like how much debt’s on the balance sheet, how much operating profit a company’s generating to make its interest payments. Now, what I do is I really hone in on this factor when the bond market starts to show signs of stress like it is right now. So here’s a chart of junk bond spreads:
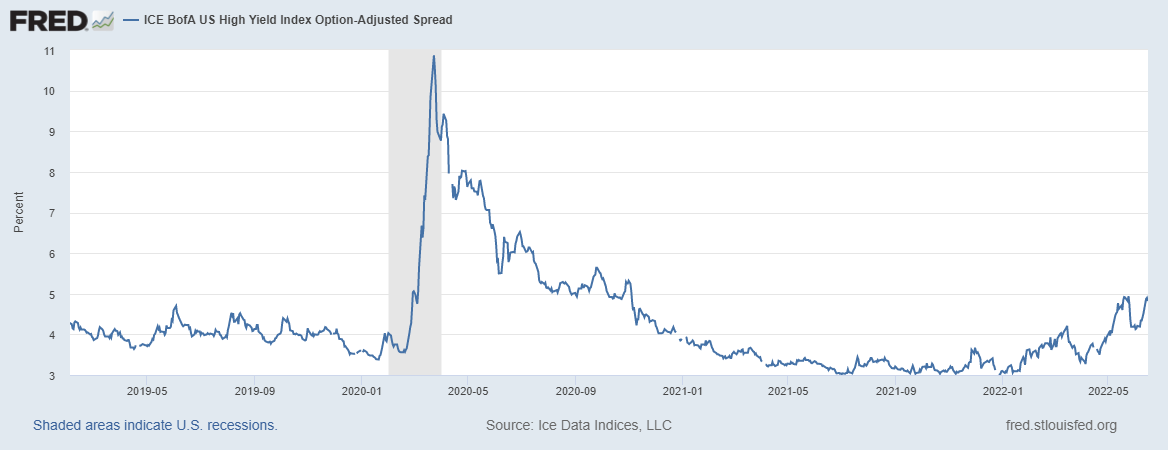
Now this spread, it’s a measure of how much extra compensation junk bond investors are demanding over a safer asset like a US Treasury Bond. A rising spread is usually a sign that investors are becoming more worried about financial distress for companies that are in just overall poor financial health. And so I took this chart back a few years, the big spike that you can see right here, that’s at the start of the pandemic. So just to put things into perspective, but more recently, you can see that spreads have turned up again, and we are now trading near the highest levels in almost two years.
So as broad signs of financial distress pick up as shown with the spread in that chart. I use credit factors to look at which companies might be most vulnerable to defaulting. And since equity holders are last in line to be repaid in the event of a default, it makes sense why the stock price would move lower and why it would be a candidate then for a put trade. All right, look, that’s it for me today. Again, I know this market, it’s tough. It’s certainly been stressing me out, but that’s also why I keep a put option strategy like this in the toolkit for when things get tough. I hope I was able to shed some light on how to use and deploy a put strategy. And once again, don’t forget about the link in the description about how to use quant factors to your advantage, whether it’s a bull or a bear market. Lastly, please don’t forget to like this video, leave your comments below and subscribe to our channel if you have not already done so, thanks.
Best regards,

Clint Lee
Research Analyst, The Bauman Letter