

Editor’s Note: In volatile times, the options market can deliver huge gains … if you know what you’re doing. Our Winning Investor Daily options experts are stepping up to help readers spot these potential opportunities.
Each week, Chad Shoop or John Ross will bring you a short-term trade. This is bonus content on top of your usual Winning Investor Daily articles. Whether you’re new to investing or an avid options trader, we think you’ll enjoy our weekly bonus options trades!
— Annie Stevenson, Managing Editor, Winning Investor Daily
It’s hard to draw up a better scenario for the price of gold and gold stocks.
Interest rates are super low. In fact, real interest rates — those that factor in inflation — are negative. Gold doesn’t offer any sort of yield, so it is much more attractive in times like this.
At the same time, fear is drifting through the markets at a Goldilocks rate — not too hot, not too cold, but just right. Just right for people to flock to gold, that is.
Gold has historically been a haven for investors to protect their capital when the stock market feels riskier than usual.
Gold stocks offer the best of both worlds — stock-like returns and gold-like safety — when fear levels is but manageable.
But buyer beware — even gold doesn’t move up in a straight line.
The price of gold broke through $1,800 an ounce this week, a record level. It hasn’t traded at these prices since 2013.
Before it goes any higher, the price trend needs to slow down or even drop.
Countertrend moves are normal and healthy. And they can happen at counterintuitive times … like when investors become overconfident in a trend.
With all this going on, a gold stock caught my attention.
This stock topped out in May and is struggling to keep up after a 71% climb in three months. It’s the perfect candidate to ride a correction to triple-digit gains in two months.
1 Gold Producer Set to Fall Hard
Newmont Corp. (NYSE: NEM) is one of the world’s largest gold producers.
Its stock performed well during the market’s pandemic-driven sell-off, weathering the volatility better than some of its smaller and riskier peers.
But everyone’s bought into gold’s bull market now, yet investors are shying away from Newmont.
It’s easier to get into large, established mining companies like Newmont. So, investors bought Newmont before other miners.
Newmont and large miners are lower-risk bets. So, their stocks offer lower-return potential relative to riskier stocks. But now that investors have pushed Newmont so high, it’s less exciting for them.
It’s time to sell NEM before new pressure — when investors respond to the short-term weakness that’s coming for gold, they’ll sell NEM heavily.
You can play Newmont’s chart setup for triple-digit gains as the stock drops.
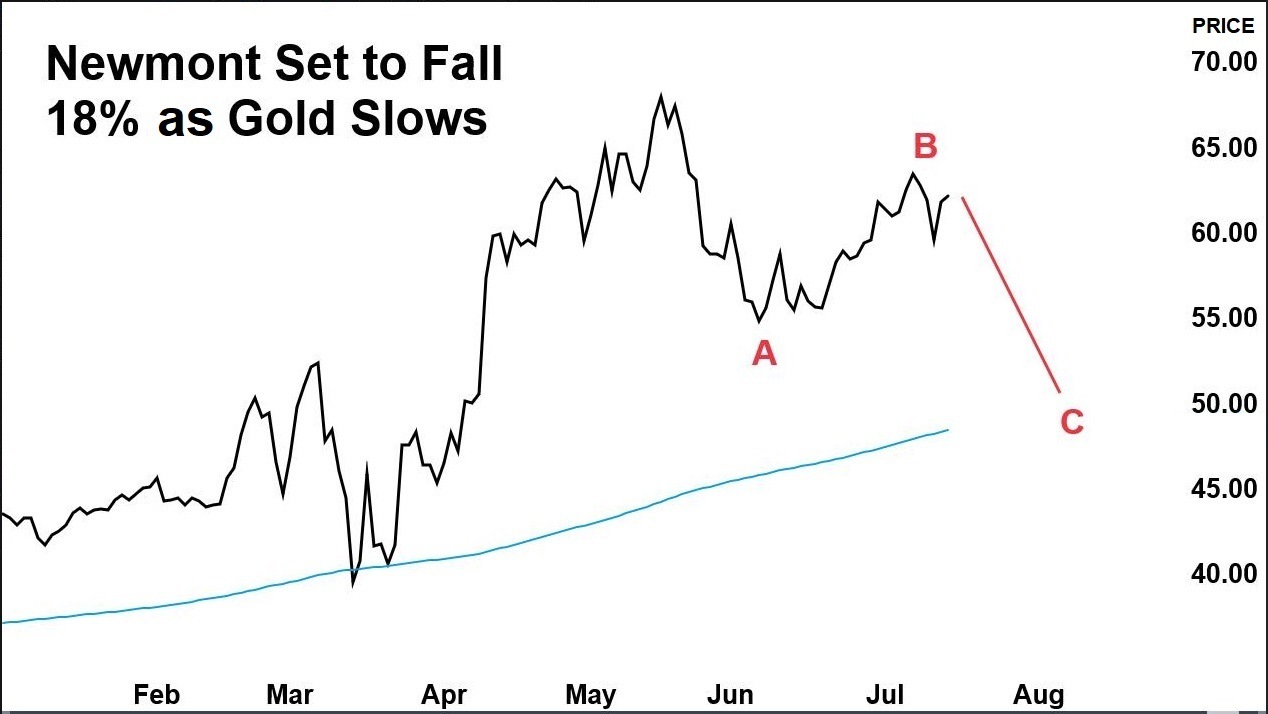
The black line is the share price of Newmont.
The blue line is the 200-day moving average, a measure of the stock’s longer-term trend. Right now, it is well below the price of NEM. This line often acts as support, a price the stock will not fall below. We expect to see that as NEM’s price weakens, it won’t fall below that line. But we do expect it to fall.
The red A-B-C pattern shows my expectations for the stock’s movement.
These patterns unfold in predictable fashion and are uncovered using technical measuring tools. I won’t get into the technical analysis here. But I will say I use these patterns to predict price trends. It’s the framework for my Apex Movement Patterns, or AMPs.
Prices are driven by basic emotions. AMPs help me identify when investors switch from fear to greed — and vice versa. These emotions tend to cause prices to move in three-wave patterns that are proportionate to its recent price history.
I expect a 18% decline to roughly $50 per share. This would constitute a logical retracement — or correction — of its uptrend.
The AMPs also determine the time frame for the trade. The measuring techniques that let us forecast price targets also tell us how long a trade should take to unfold. In this case, we expect the move to take about two months.
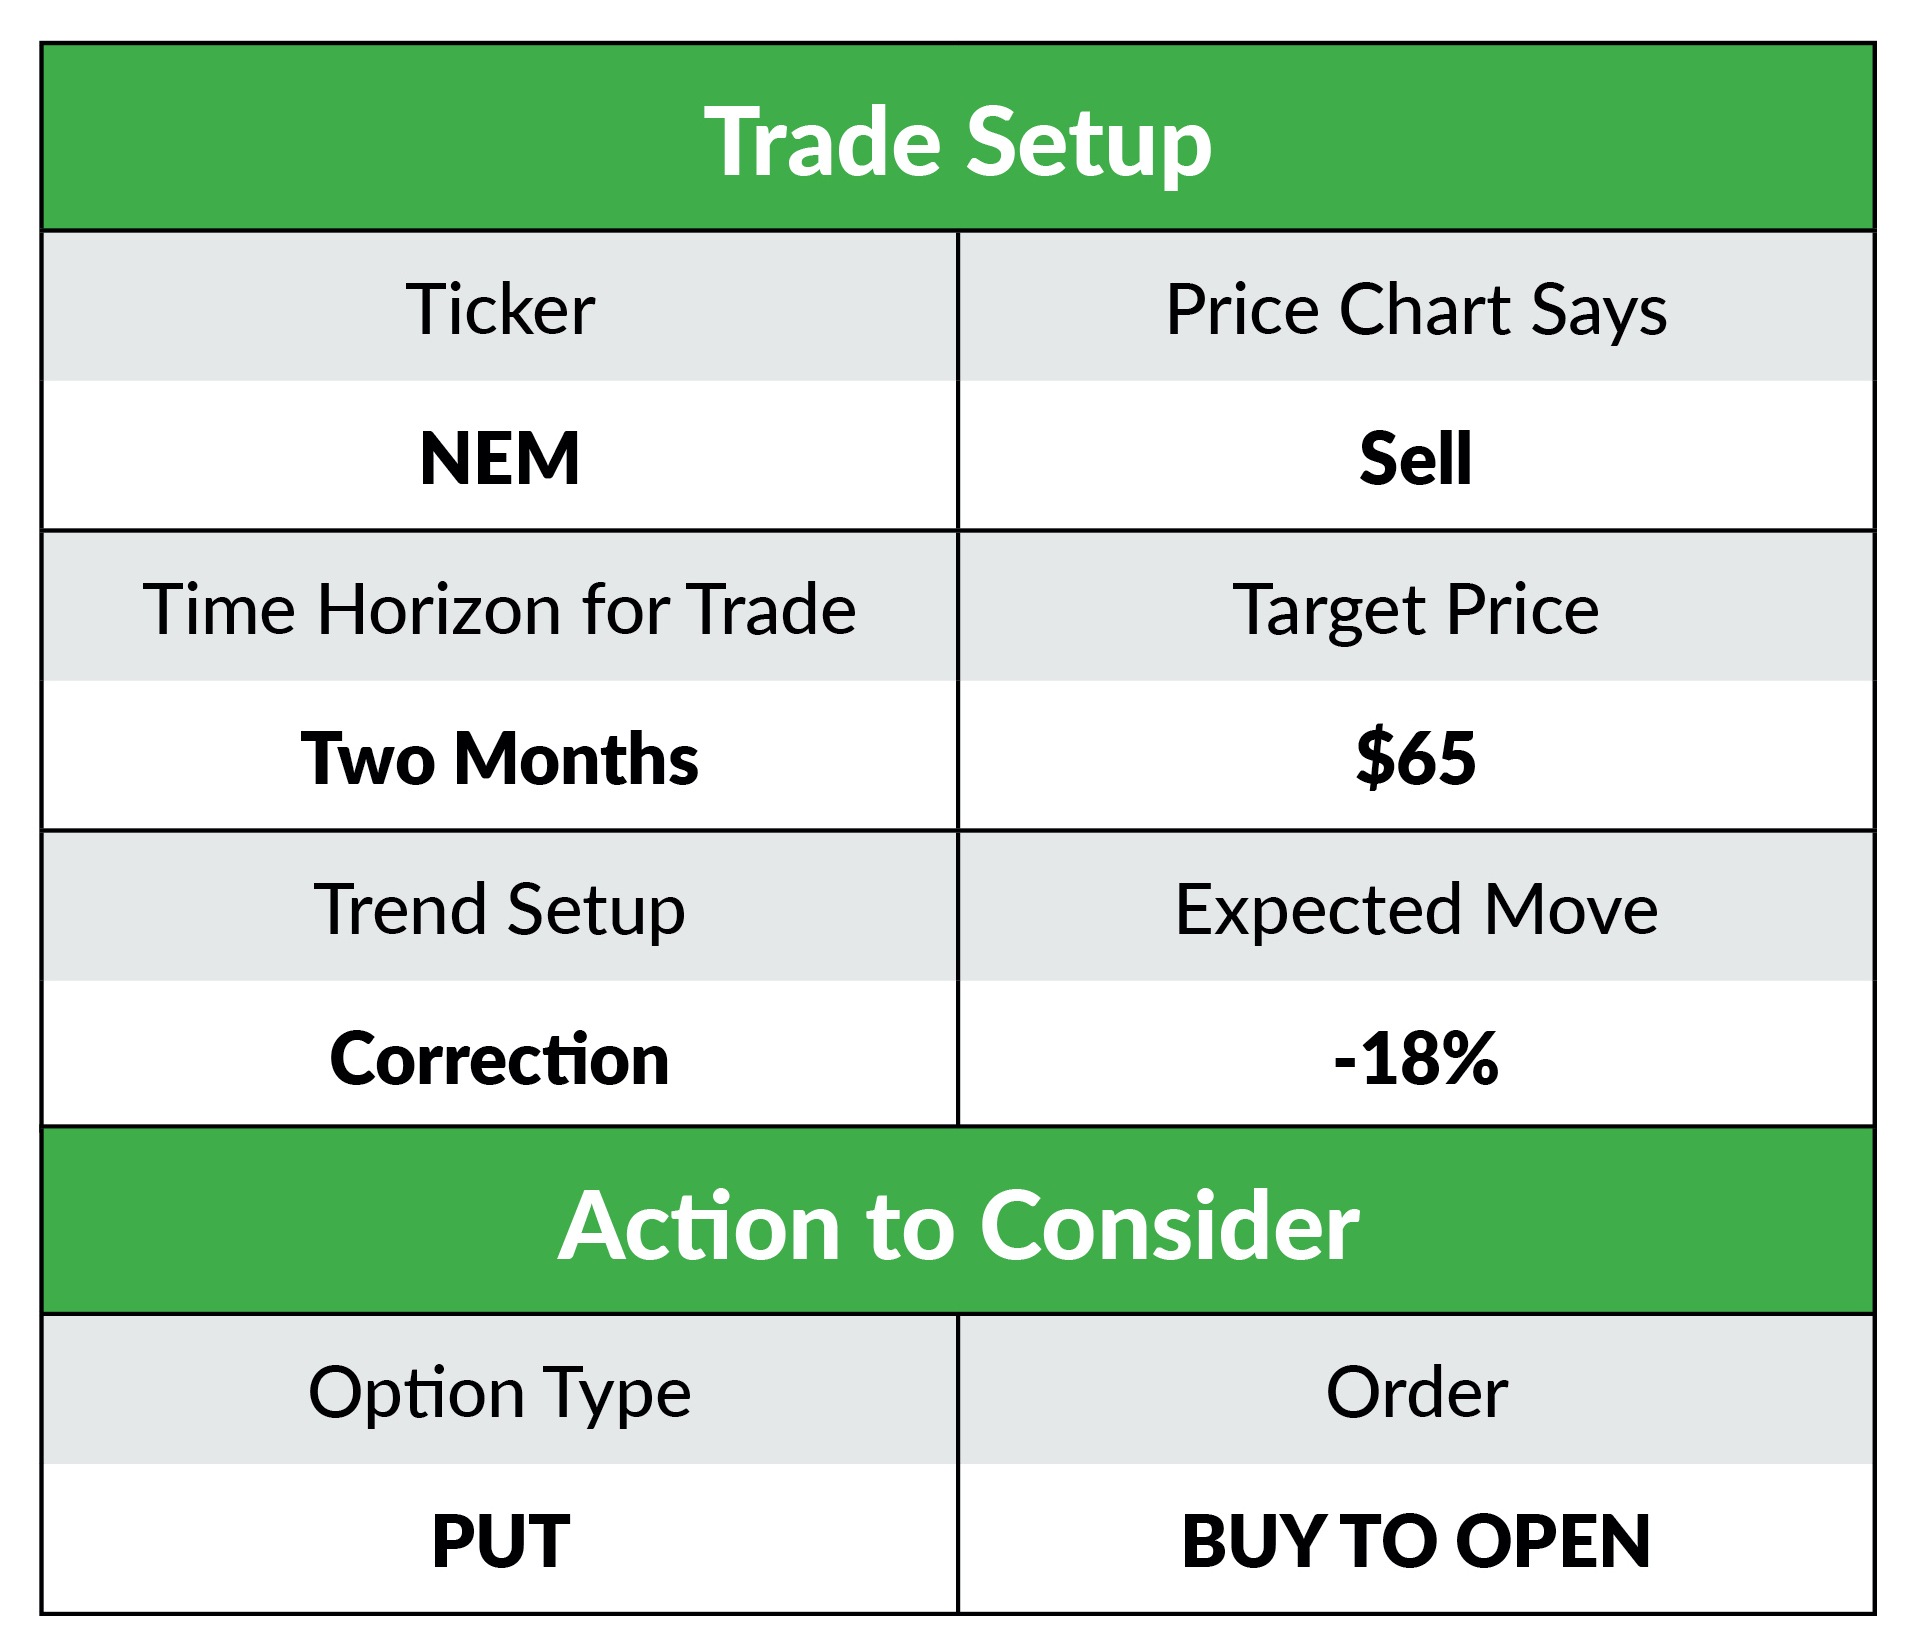
Your Trade Setup
To benefit from the downside in Newmont, you can buy a put option. The value of the put will rise as the stock declines.
Since we expect the move in two months or less, we can use the September 18, 2020 expiration date to take advantage of it.
With the stock trading around $62 right now, we can buy the $65 strike price option for roughly $6.60.
That gets us in a position to double our money as the stock price moves towards $50 a share over the next month or so.
Since this is a bonus opportunity, we won’t be updating you on what action to take next. But we will tell you that a good rule of thumb is to set a limit order to sell half at whatever would net you a 50% gain.
For example, if you buy the put option for $6.60, you can set a limit order to sell half as the option’s value hits $9.90.
But you’ll also want to watch your downside risk. Prepare to preserve capital if the option value falls below a 50% loss. That means you should exit the position if it falls by half.
Here’s a table with the trade setup:
Reach out to us at WinningInvestor@BanyanHill.com with questions or feedback!
Good investing,

Editor, Apex Profit Alert
Editor’s Note:
P.S. If you’ve never traded options before, you’re not alone. Many people don’t even know how to access them in their accounts. Options are one of the best and safest ways to make triple-digit gains in the market. And our options expert Chad Shoop wants everyone to be able to make their own trades. He’s created a Weekly Options Corner to help his readers learn the basics. It’s completely free. All you need is your email address.
— Annie Stevenson, Managing Editor, Winning Investor Daily