We often forget prices move in three directions. There’s the welcome uptrend. That’s when stock prices go up and we believe we are geniuses.
There’s the feared downtrend. That’s when prices fall because of the Federal Reserve, the president or something else we can blame.
There’s also the annoying sideways trend. That’s when prices make no up or down progress for months at a time.
While investors often forget about sideways trends, analysts noted that trend more than a century ago. Charles Dow, founder of the Wall Street Journal and the Dow Jones Industrial Average, wrote about sideways trends in the early 1900s.
He named the pattern a “line,” because a straight line connects the market action on a price chart. Dow explained that a line serves the same purpose as a downtrend.
And while a sideways market can be incredibly frustrating to trade while it’s happening, it also sets up for an amazing opportunity to make huge profits.
Downtrends Correct Traders’ Mistakes
Many investors hate downtrends, or bear markets. But, they serve an important role in the markets. Bear markets correct excesses. And, traders always take prices to excessive levels.
During uptrends, investors always get too optimistic. They push prices higher than justified by fundamentals. A downtrend puts prices back in line with the fundamentals.
But, a sideways trend also puts prices back in line with fundamentals. Sideways price action allows time for the fundamentals to catch up with price.
That’s important to remember as major stock market averages make new highs. These are the first new highs in the S&P 500 Index or the Dow Jones Industrial Average since January. That means prices have been moving sideways for seven months.
And during that time period, fundamentals improved quite a bit. This year’s estimated earnings per share (EPS) for the companies in the S&P 500 jumped 8.7% over that time.
So, the sideways price action allowed prices to catch up with fundamentals. Now, it’s time for traders to push prices too high.
History Says a Rally Is Due
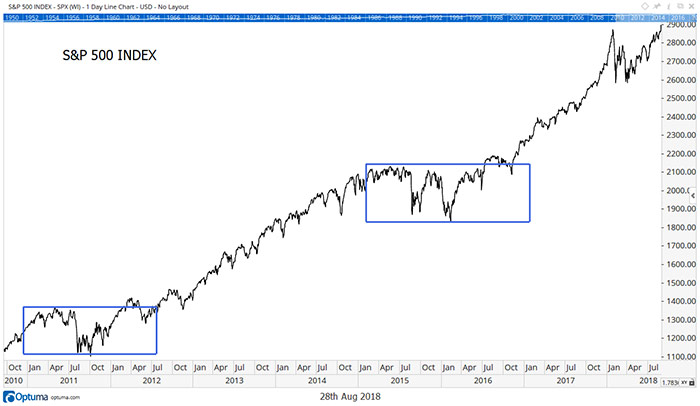
This is the third time prices moved in a line since the bull market began in 2009.

Big uptrends followed the two previous examples.
And, now, the economy and earnings look bullish. The Federal Reserve Bank of Atlanta expects gross domestic product growth of 4.6% this quarter. Standard & Poor’s expects EPS growth of 9.1% for the current quarter, compared to the period a year ago.
Everything is in place for the next uptrend. In fact, prices are set up for the next bubble.
EPS growth is higher than average. But, most of this year’s growth comes from tax reform. That’s a one-time gain.
Traders will push prices too far, expecting rapid earnings growth to continue. It won’t. It simply can’t.
Earnings growth will slow down at the beginning of 2019. That’s because earnings cannot grow as fast as they did this year without additional tax reform. And that will not happen.
Many traders focus on the market action. They think about the short term and fail to look ahead.
The slowdown in earnings that’s guaranteed to happen next year will catch some traders by surprise. And, that could trigger a steep sell-off.
But, until then, expect prices to rally sharply. New highs in the S&P 500 should continue into the end of the year.
Now is the time to buy as traders scramble to catch the uptrend.
Regards,

Michael Carr, CMT
Editor, Precision Profits


