
Sometimes I think it would be nice to be a finance professor.
They’re allowed to, even encouraged to, have poor theories about investing.
Then, when some piece of data contradicts the theory, they call it an anomaly and no one bats an eye.
From a practical perspective, we might think a theory with anomalies is wrong. It doesn’t make a difference to finance professors, because investing isn’t where they make their money.
But most of us aren’t Ph.D.s at business schools. We’re investors. We have to make money in the markets, not from book sales.
So, we must recognize and profit from those anomalies that the Ph.D.s shy away from.
The greatest financial lie ever told was through one such investment theory that’s riddled with anomalies.
This theory miraculously led to the absorption of trillions of dollars in wealth, despite promising mediocre investment returns.
I have spent my entire career rejecting this theory, and proving that doing so leads to far greater returns and far greater control over your wealth.
Today, I’ll show you what I’ve been doing lately to continue this mission.
The Lie of the Efficient Market Hypothesis
The theory that inevitably leads to mediocre investment returns is the efficient market hypothesis, or EMH.
The strictest version of the EMH says that stock prices are perpetually correct. The current market price of any stock is that price because it reflects all available information. So, the market price is always the correct price of the stock.
If that’s true, it is impossible for any investor to beat the market. Many believe this. And that’s why index funds, which commit completely to EMH, hold trillions of dollars in wealth.
But there’s a lot of evidence showing you can beat the market.
Value investors who buy individual companies at cheap prices have a long history of success. So do investors specializing in small-cap stocks. Other great investors have found success by trading with momentum.
Value, market cap and momentum are three of the anomalies to the efficient market hypothesis. There are many more. Each of them offers investors a potential path to market-beating profits.
The business school professors know this. Many of them wrote papers on anomalies. These papers often, inadvertently, provide the first step on the path to profits.
When I managed money, we started our pitch to potential investors by explaining that we exploit the momentum anomaly to the EMH.
Many investors prefer simpler terms, so they call anomalies “factors.” Then they overweigh select factors in their portfolio.
Warren Buffett, for example, overweighs the value factor. Many money managers overweigh the momentum factor. Some create niches overweighting quality of earnings, return on invested capital or other factors.
Institutional investors have done this for decades. Individual investors haven’t had the chance — until recently.
Democratizing Data
Exploiting factors requires access to data. To exploit momentum, you need access to price data. To exploit value, you need access to fundamental data.
For a long time, data was prohibitively expensive. Even investors who find the cost reasonable will need to spend time or more money writing customized software to identify the factors before they can start acting on them.
That’s why many investors take shortcuts to investing in these factors.
Most of the individual investors I’ve met over the years say they’re value investors. They might only buy stocks with low price-to-earnings (P/E) ratios. Or they’ll use some other readily available metric to find attractive stocks.
This isn’t the way to exploit those anomalies.
True factor investing requires analyzing the factor for every stock. The values need to be calculated, then sorted and ranked. There also need to be rules for when to buy and sell.
It’s much more involved than saying “I buy when the P/E ratio is below 15.”
Even though data is more accessible than ever to individual investors, there still isn’t much access to factors.
Money & Markets offers its Stock Power Rating system which provides factor scores for thousands of stocks.
The free website provides stock scores for six factors, three related a company’s financial statement and three derived from the price action. An introduction to the system is here.
Lately, I’ve been utilizing this rating system to design some of my own systems. And I’ll share exactly what I’ve come up with next week.
In the meantime, though, take some time to punch a few tickers into the Stock Power Rating system at Money and Markets. You can easily use it to find stocks with strengths in certain factors, weaknesses in others or even the rare occurrences where a stock is strong across the board.
Regards, Michael CarrEditor, One Trade
P.S. Adam O’Dell, the brains behind the Stock Power Rating system, uses it for a lot more than finding great stocks to buy.
If you’ve spent any time with the system, you know that it also flags potential landmine stocks you’ll want to steer clear from.
Or, if you know a thing or two about how to profit from falling stocks, you can target them for profits.
That’s exactly what Adam’s doing with what he believes is one of the market’s biggest landmines. It scores a dismal 22 out of 100 on the Stock Power Ratings system and has lost hundreds of billions of dollars in value.
The tragic part of all this is that almost everyone owns this stock, whether they want to or not. But Adam’s fighting back. Go here to learn how you can too.
Going the Wrong Direction

If you’re a current or aspiring homeowner, chances are you’re watching the real estate market closely… Low interest rates in the years leading up to 2022 had the effect of inflating virtually everything … including home prices.
But for the vast majority of Americans, the price of the house is far less important than the size of the monthly payment. And the lower rates went, the more expensive the house that the typical homeowner could “afford” based on the monthly payment.
That was great when rates were falling. It’s not so great when they’re going the other direction.
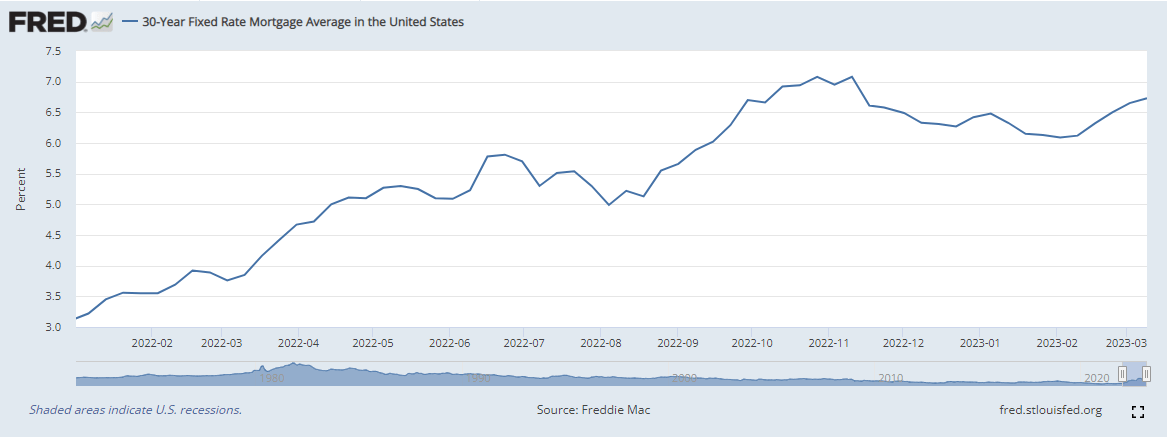
The average 30-year mortgage rate topped out at a little over 7% in late October and then started to drift lower over the next several months … until rates reversed course and started trending higher again in February.
Something has to give here. With would-be homebuyers now priced out of the homes they planned to buy, existing home sales have dropped by about a third over the past year.
Prices haven’t collapsed (at least, not yet) because existing homeowners appear to be taking their homes off the market rather than reducing the sale price. The number of homes for sale has steadily decreased over the past year and shows no sign of reversing.
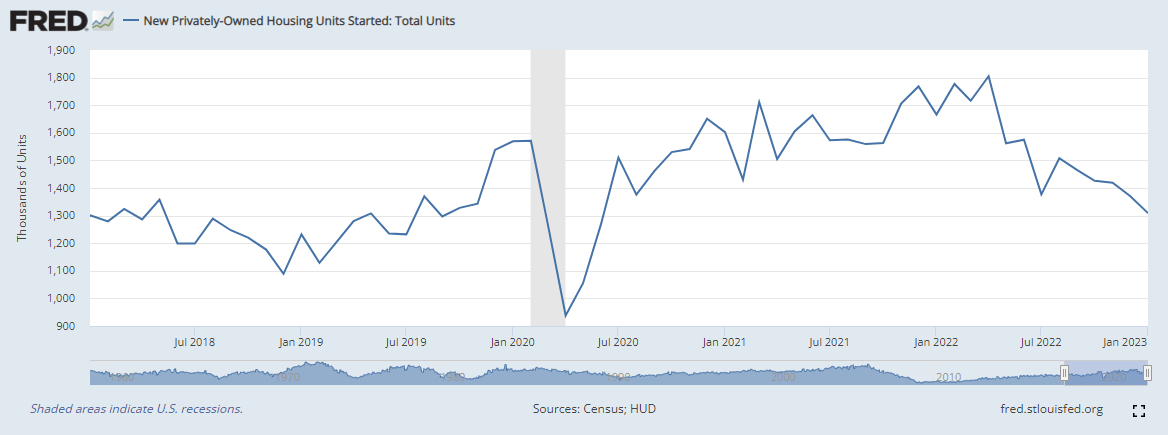
Here’s the thing. Despite the lack of affordability, home prices might not outright collapse because the inventory of new homes just simply isn’t there. New housing starts have also been sharply declining.
So … what does all of this mean?
It likely means no immediate relief for high rents. It also means would-be buyers are priced out of the market due to high interest rates, but inventory is simultaneously too tight for meaningful price declines.
If you’re an existing homeowner, great! You’re in a good spot, and you have an asset you can potentially rent out.
But if you’re looking to buy, you might be waiting for a while. And you might want to get used to elevated rent.
Regards, Charles SizemoreChief Editor, The Banyan Edge