I’ve been watching gold closely.
I wrote about this hot commodity a couple of weeks ago. I let you know that large speculators now hold a net short position on gold.
That is a bullish sign underpinning gold prices.
Today, we’ll look at the key, long-term trendline that is supporting this bullish view. And I’ll explain why it is critical to watch in the coming weeks.
First, the chart.
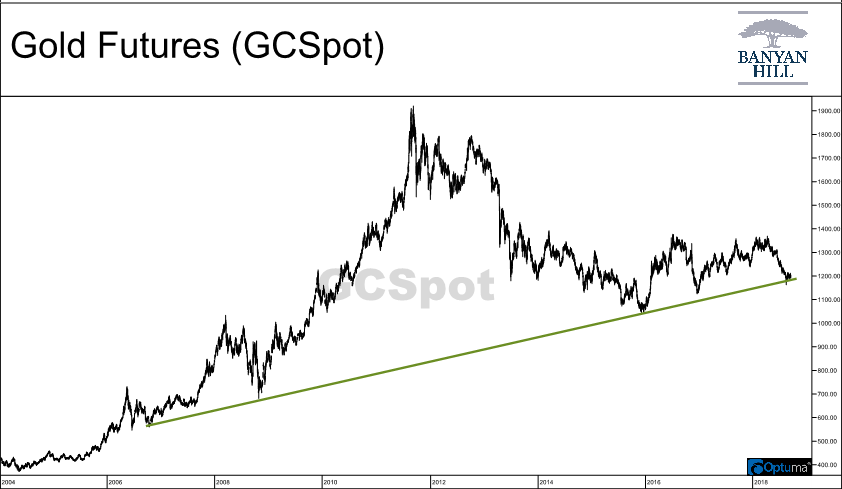
You can see that gold prices are trading right at a trendline, in green on the chart.
This particular trendline has been tested three other times. Once back in 2009, then again six years later in 2015 and briefly in 2017 as well. Each time, it has held up.
Now prices are back to this key level, and my outlook for gold relies on this trendline holding up.
That’s because a trendline of this duration, and tested this many times, is on everyone’s radar — it simply cannot be ignored at this point.
Those two things, duration and times tested, are what tell you the importance of a trendline.
Over a decade long and at its fourth test are both signs this trendline is critical for gold.
If prices stay above the trendline, we can expect a continued rally.
If gold breaks below it, the decline will be rapid. A 20% to 30% decline in a matter of months is likely.
But despite the dire news that may be just around the corner, I remain bullish on gold.
That’s because until that trendline is broken, it’s a bullish sign.
The trendline is sitting around $1,185 per ounce of gold at the moment. Since it is an upward trendline, it means the dollar amount creeps higher each and every day.
This will be something I continue to track closely, and you should to, to determine the next major breakout in gold prices.
Regards,

Chad Shoop, CMT
Editor, Automatic Profits Alert