

Two powerful forces have closed in on growth stocks: the Federal Reserve and the pandemic.
But, what does this mean for the rest of the market?
Are we seeing another dot-com peak followed by a waterfall decline?
Or is this just a profitable rotation for smart investors?
In today’s Your Money Matters, Ted Bauman and Clint Lee discuss the fall of growth stocks, the Fed’s tapering timeline, and how you can protect and grow your portfolio.
“No Hard Feelings, Tech Stocks”
Last Wednesday, the Fed released minutes from its December meeting.
Officials plan to reduce balance sheets earlier than expected, causing much alarm among investors.
The ensuing sell-off led to the Nasdaq 100 falling 3.12% that day!
The stocks hit the hardest: technology.
Ted and Clint explain why that is and how even the large-cap tech stocks are affected by the Fed’s new hawkish attitude toward inflation.
Click here to watch this week’s video or click on the image below:
VIDEO TRANSCRIPT
Ted:
Hello everybody. This is Ted Bauman here, editor of Bauman Daily and The Bauman Letter. We’re doing Your Money Matters today, but we’re doing it a little differently. Angela Jirau is not going to be joining us today. Instead, Clint and I are going to be really having kind of a friendly chat about what’s going on in the markets and, in particular, what is likely to happen as a result of, basically, the Fed’s increasingly hawkish approach to interest rate management and, more particularly, the management of its balance sheet.
Just to give you a little bit of background on what that means is, I mean, basically over the last decade or so, the Fed has been buying financial assets out of the market (Treasury bills, mortgage-backed securities) and those go onto the Fed’s balance sheet, and it buys them in return for reserves that banks can use if they so choose to do things like lend money or just stick them in their reserve accounts at the Fed.
But whatever it is, it’s supposed to ease financial conditions. Since COVID, it’s got to the point where the Fed realizes that this is not helpful anymore. I mean, basically that’s what the deal is. A lot of people blame the Fed for inflation, but really all this, Clint, it’s about asset price inflation. So, what we’re seeing now is a collapse of those particular assets that depended so much on the Fed, this quantitative easing and all this kind of stuff. So, Clint, walk us through what’s been happening…
Clint:
I think what’s caught a lot of people by surprise, a lot of investors by surprise, is how quickly the Fed’s views have evolved because we’re really only talking about a little bit over a month here from the time when they started dropping the whole, “it’s transitory” message. From the inflation picture to acknowledging that risk to then pulling forward expectations for rate hikes, pulling for the expectation to start to taper the asset purchases that you were talking about under quantitative easing.
Then we got another surprise with the Fed’s minutes from their most recent meeting this past week when they came out and said, after they implemented that first rate hike, that they could start to actually reduce the balance sheets.
So, with tapering, all that is, is just slowing purchases. I mean, the balance sheet can actually still grow under tapering. They’re still purchasing securities … it’s just at a slower amount. Now, we’re facing this scenario in which you could actually start to shrink the balance sheet and kind of accelerate that effort to take more liquidity out of the system.
Ted:
So, let’s just show a picture. Here’s a chart that comes from Goldman Sachs:
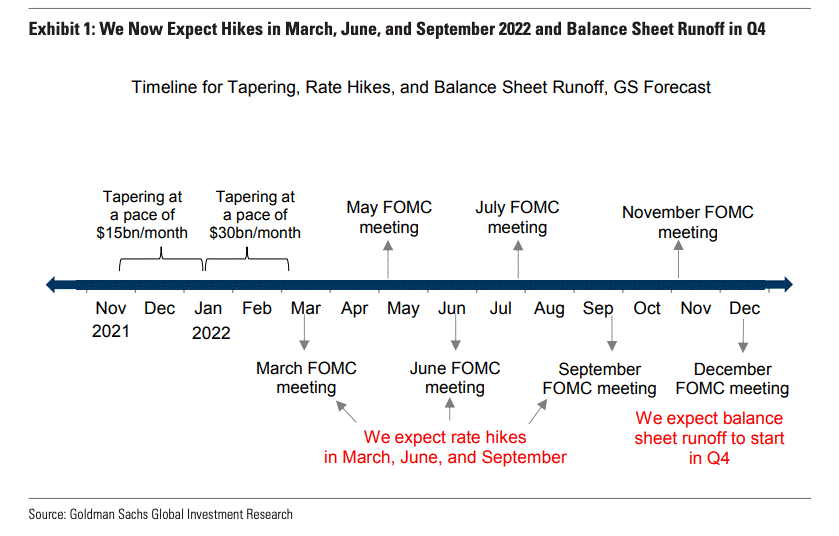
It shows what their expectations are, and they’re saying they expect rate hikes in March, June and September. Normally, they’d be 250 basis points each, and then they say they expect balance sheet runoff to start in quarter four, but maybe it’ll happen in quarter three, but basically what all of it means is that the Fed is going to be pulling out of this part of the market.
I want to kind of challenge the conventional wisdom on this. People say that the Fed needs to do this to stop runaway inflation, but what does the Fed have to do with inflation, Clint? I mean, tell me what the Fed’s doing to contribute to inflation? See if you can figure that one out for me.
Clint:
I mean, we’ve talked already about how it contributes to asset price inflation. A lot of what we’re seeing today has to do more with the disruptions that we’re seeing in supply chains. You know, what I think is interesting is, right when they’ve decided to drop the whole transitory messaging from this, we’ve actually seen a couple signs that pricing pressures are peaking out.
So, one of the things I watch with these PMI (Purchasing Manager Indexes) and manufacturing service sectors, you can go in and look on all these underlying components of it and the prices paid component for the manufacturing one dropped pretty significantly in the last report. Now, we’ll see if that stays the trend, but I mean, you’ve talked recently about policy mistakes. Well, we’ll see if we have one in the making.
Ted:
Yeah. So, basically look, I mean, what a lot of people say is that the Fed is trying to address inflation that wasn’t caused by the Fed and that can’t be ended by the Fed. So, we know about cars. We know about used cars. We know about energy. We know about all these things that relate to supply side issues but, at the same time, the Fed has got a public relations issue, too.
I mean, if the Fed is not being seen as bullish about inflation, that sends panic through the markets, whether that panic is justified or not. So, what we’ve got now is a situation where the Fed says it’s going to do all these things. So, let me just show a couple of charts. We’ll try to keep the charts to a minimum, but I just want to show what’s going on and how rapidly all this is changing.
Here’s a chart that shows the 10-, 5- and 30-year yields on Treasury bonds. It goes back to mid-December.
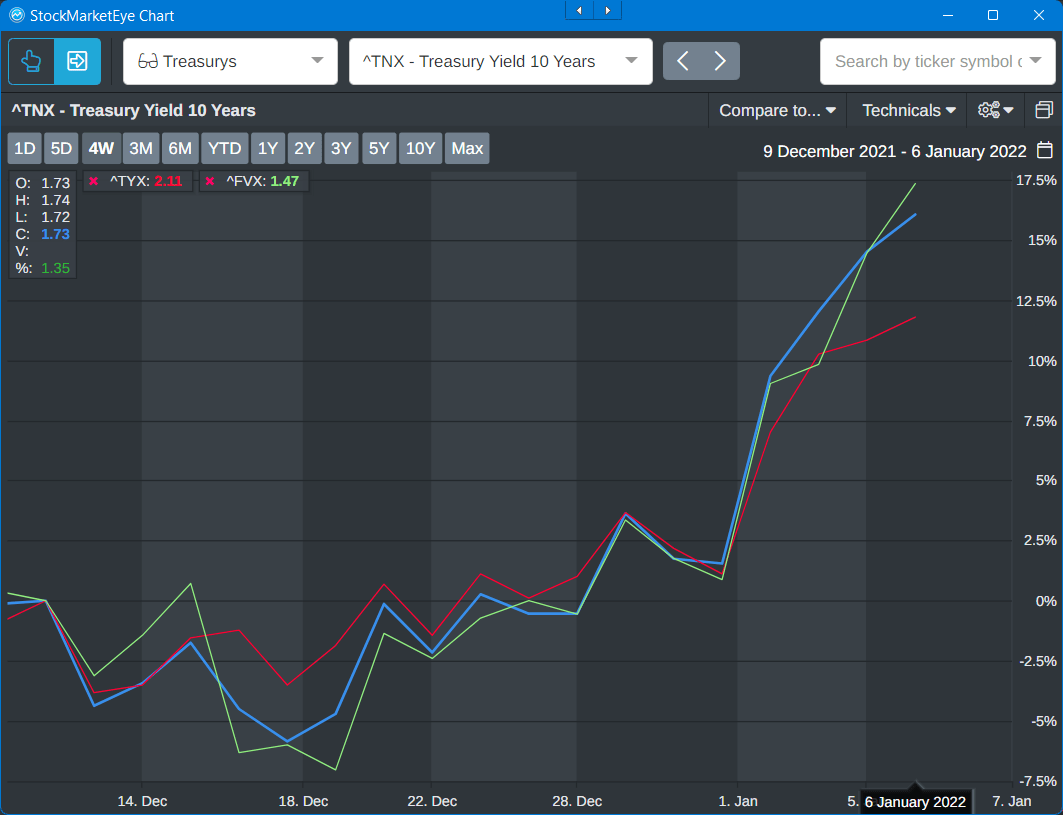
Pretty clear what’s going on there. They started to tick up mid-December, but look what’s happened since the beginning of the year. That’s a pretty steep increase, and that’s all due to the Fed.
So, the next chart just basically says, look, here’s what’s happening to the overall indexes.
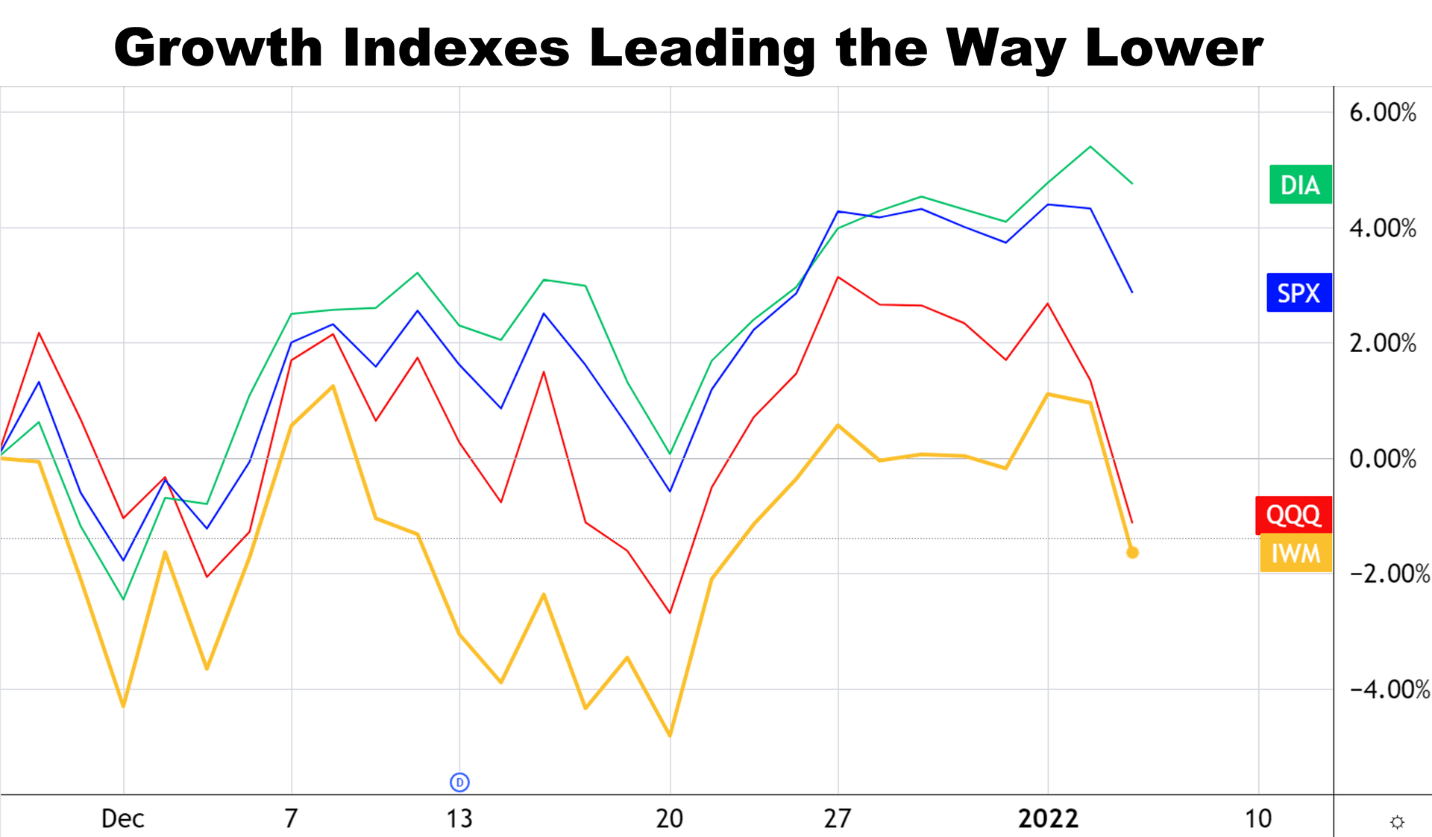
There’s the Dow, there’s the S&P 500, but look at QQQ and IWM. Those are proxies for tech and for the Nasdaq, pretty steep dives.
The last chart I’m going to show you is the so-called FAANG stocks, or at least some of them, this is since the beginning of the year, so not a lot of data here, but the message is clear.
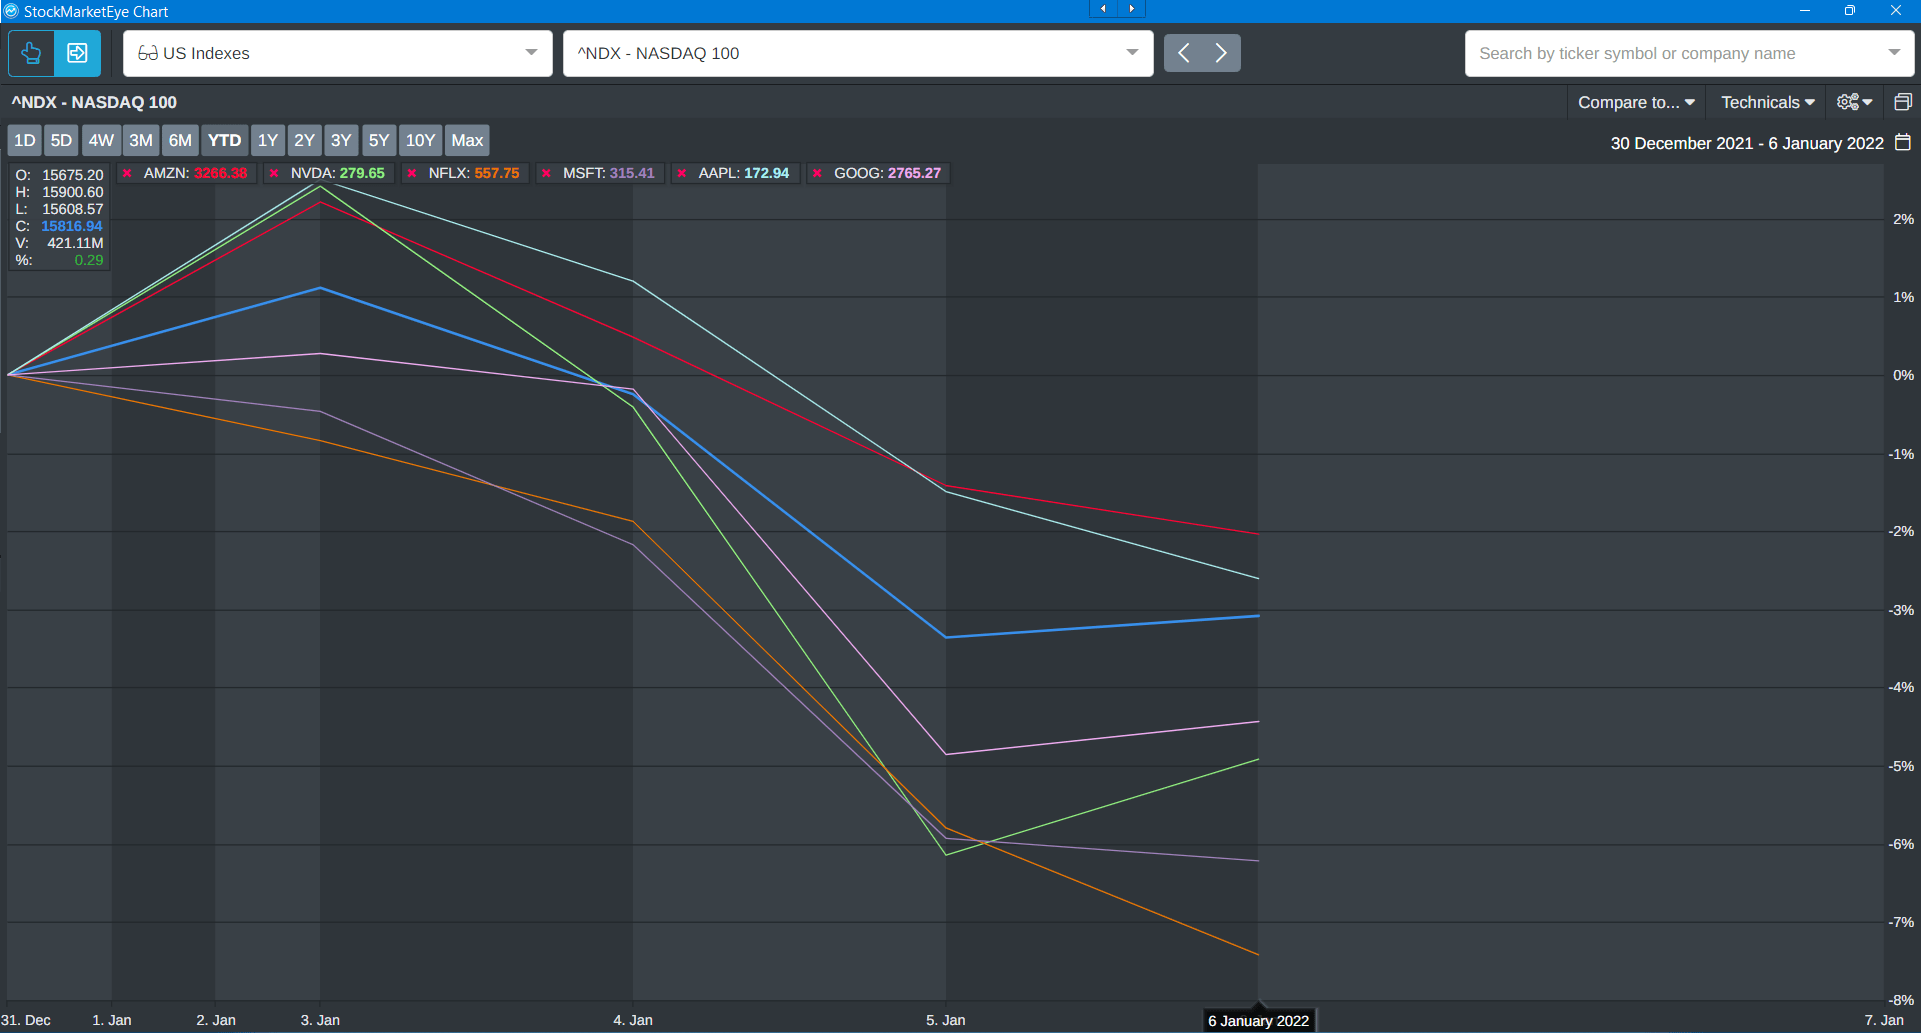
It’s not just the small tech growth stocks. It’s also the big ones. So, why would that be happening?
Clint:
Yeah, I mean, that’s what I was going to say. Let’s tie this all back in…
Whether the Fed causes inflation or not, what we do know is that they’re tightening policy, their hiking rates, we talk about how it’s draining liquidity from the system, but what does this mean for stocks? Well, especially in the growth space, there’s two big factors at play here, as you see interest rates rise, as we are highlighting.
One is just the competition for capital. I mean, money is going to flow to where it can earn the best return, and rates have been stuck at zero. We’ve been in a low rate environment for so long, so as yields on safer fixed income investments start to come up, that’s going to be more competitive for investor dollars.
Now, the other thing, and this is where this really hits the growth stocks, is rising rates makes future cash flows worthless. That’s a big sticking point for growth stocks. You’re paying a higher valuation now because you’re expecting all these profits down the road, while all those profits down the road, when you discount those back at a higher interest rate, they’re worthless in today’s dollars.
So, that’s the big impact you’re seeing now. I think the big question, too, is this kind of across the market? Are we now sort of the dot-com peak and it’s a waterfall decline from here or is this more targeted to those specific growth sectors, tech sectors?
Ted:
Well, let me comment on that because I was going to say earlier, when you talked about the Fed making a policy mistake, I think the Fed is actually playing a double game here. I think what they’re doing is, they are publicly saying that they’re addressing inflation in consumer markets, but they know full well that they can’t do that. That’s not what’s driving inflation.
Inflation is being caused by supply side stuff and also by the enormous amount of money that the Fed or that the federal government has pumped into the economy in the form of stimulus. I mean, let’s just be realistic. Everybody, whether you’re Friedmanite or whether you’re into MMT, whatever it is, everybody agrees that a lot of money chasing few goods is going to cause inflation. Fine, right?
Now, that’s all disappearing, and the Fed knows that. I think what the Fed is doing is signaling that it wants to start raining in the froth in asset markets. I think that’s what this is really about, but they’re not going to say that because they don’t want to spook the markets, but people have been talking for years now about how the Fed has dug themselves into a hole and they need to climb out of that hole and fill it in.
You know, you can’t carry on where the Fed is essentially propping up asset markets … where the Fed has got a huge put under all these assets, and so now they got to fall. So, the big question is, which ones are going to fall? You spoke about smaller-cap growth stocks, the ones that are very interest rate sensitive, but what about the big ones? What about the ones that have carried the market for the last year?
I’m going to ask you to comment on that, but I just want to flash up, this a table that shows the current price-to-earnings ratios and various other metrics for the “big guys:” the Teslas, Amazons, Apples and all that.
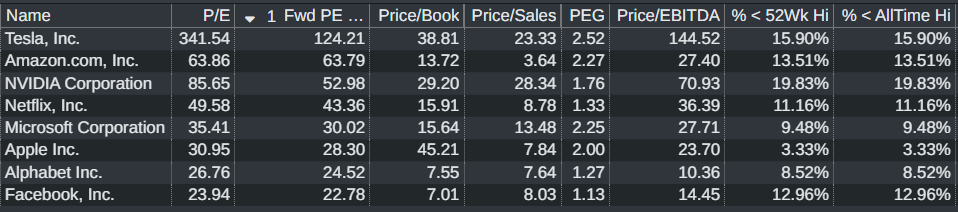
They’re forward P/Es. In some cases, Apple, Alphabet, Facebook are not too bad, Microsoft, not too bad, but the further up you get, Amazon 64%, Nvidia 53%. I mean, those are very, very high.
Then price to sales. I mean, Tesla price to sales, Nvidia, Microsoft. I mean, those are pretty high. That stock’s a lot higher than the 10% that we normally recommend. Then, of course, PEG. Anything over 1 is considered to be a little bit over value.
So, my key thing here is simply that, what if it’s not just the small ones? What if it’s the big ones, too? Then what happens?
Clint:
So, I think there’s a couple of really important implications for how investors approach 2022 here. I’ll give you an example of what we’ve seen just to start the new year with this week. So, here’s a table:
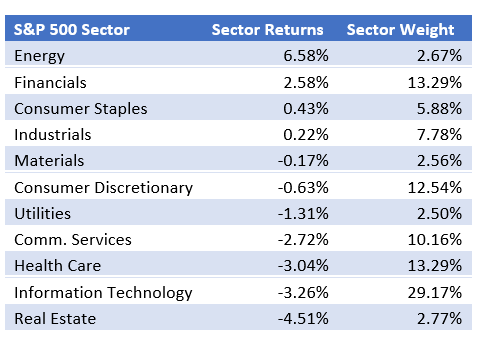
It just shows this is through Thursday, the year-to-date returns for sectors in the S&P 500. So, you’ve got the sector returns, then you’ve got the sector weight as well.
So now, overall, once again, as of Thursday, the market’s down about 1.4%, so the S&P’s down 1.4%, but you can see it’s not, we’re not seeing red across the board. I mean, you have sectors such as energy and financials that are putting up some pretty nice, decent size gains on the year, but when you look at their weight, their combined weight is about half of what the technology sector is.
So, a lot of those names you were rattling off are in the tech sector. The tech sector is the second worst-performing sector here on the year so far. So, we’re in this scenario. We’re in this situation where it looks like the broader market is under pressure, but it’s really this concentration that we’ve seen at the top in terms of market cap. Those are the ones that are more susceptible to these valuation pressures.
So, this is important, especially if you’re an index investor. If you’re holding the SPY ETF or you’re holding the QQQs, 2021 was very good to you. 2022, with these valuation issues, if we start seeing that pressure at the top, that could be a very different story. Meanwhile, average stock, especially with what we’ve seen in cyclicals and on the value side, have started off the year very well.
Ted:
Yeah. I mean, a lot of it comes down to what some people are calling a rotation, and we were discussing earlier a Bloomberg article that came out this morning saying this is a rotation from what was the big thing, really for the last decade, into cyclical and real economy stocks. This is something we’ve been talking about a lot, really going on for the last six to nine months or something, saying this is going to happen.
At The Bauman Letter, all of our major selections over the last six to nine months have been all about quality, about earning cash flow, about paying dividends and people say, “Oh, well, but you didn’t beat the market.” Well, that’s because we are preparing ourselves for what’s coming.
The market last year was over-weighted toward those stocks that, on your chart, it’s 29% of market cap, but it’s down three and a quarter percent already. If that carries on like that, then you’re not going to get gains at the index level and you’re not going to get gains for those kind of stocks.
So, where are you going to get them? You’ve got to go looking elsewhere. So, we’ve been kind of pre-loading ourselves for this. People will say, “Well, yeah, but you recommended a REIT or whatever, and it’s down by 5%. Who cares? It’s paying a dividend of 6%, right? It’s going to raise that dividend.
For example, if you’re buying REITs that are undervalued because of people worried about the pandemic and COVID, well, they’re bouncing back already because we know that Omicron is not as serious as the previous strains. I think that’s the way to go. I think you’ve got to go looking for quality for cashflow and earnings. I know there are some people who are going to go, “Oh yeah, but you’re being an old fuddy duddy.” Well, we’ll see.
Clint:
I’ve got one comment and then one question for you. I mean, the comment is, we’re seeing the sector rotation. That’s what it looks like, at least so far this year, even though the indexers are down, you know, what we just highlighted. It’s all the mega-cap tech names dragging markets slower. I would absolutely be fixated on fixed income markets this year to try to determine if the sector rotation becomes part of a bigger meltdown.
There’re two key signals I would watch for. One is high yield spreads. High yield spreads started moving higher well before the dot-com bus. They started moving higher in late ’07 before the financial crisis. High yield spreads have stayed low so far. That’s one area I would keep an eye on.
Ted:
You’re talking about corporate borrowings.
Clint:
Right, exactly.
Ted:
It’s junk borrowings and stuff like that, which is a very, very sensitive thing because you know, you get financial crises. That’s how they start, when those spreads get very high.
Clint:
Right. Then the other fixed income signal is just the yield curve itself. For example, you look at the yield on the 10-year Treasury versus a three-month Treasury. The yield curve, once again, going into dot-com became inverted.
Either it’s a combination of the Fed raising the short end or long end rates coming down, a lot of times because of the growth outlook, but yield curve went inverted before the dot-com bust. It went inverted before the financial crisis today. Right now, the yield curve’s actually been steepening. That could change.
Ted:
I think that’s precisely it, because I think the current view of the market is that the Fed is going to raise the short end, but the long end is going to also raise, which is what we’re seeing with the 30s up, and that’s because they expect the economy to be strong.
So, therefore, they think that we’re going to move from a situation where everybody was plowing their money into speculative assets because there was nothing else to do because of COVID and an economy that’s recovering where everybody’s going to start spending a lot of money, and that will then lead the Fed to raise interest rates in order to kind of cool things down, which is actually a good sign.
So, if you get short-term and long-term interest rates rising and, paradoxically, that’s probably the best thing because it shakes out all these nonsense stocks that are overvalued. Yeah, we bought some of those, too, when they were overvalued because who knew? You know what I’m saying? I mean, these things are completely unpredictable.
Clint:
Yeah. So, what do you do with those now because, once again, yield curve, high-yield spreads or whatever, I mean, it all suggests that we’re not seeing a broader stock market issue, but we are seeing an issue with those growth stocks. I mean, what’s the process that you would go through to look at these. If they’re in your portfolio and you’re trying to decide if one’s worth holding on to versus cutting, what are you looking at in that regard?
Ted:
Well, really, it’s pretty straightforward, and the main thing is, I’m looking at revenue estimates for the next two years and where that revenue’s likely to go. So, you take the base case that if the P/E ratio stays where it is right now and revenue increases and you get potential earnings per share increases, just mathematically what’s going to happen to the stock price?
If it’s enough to justify holding, you hold. If it’s not, you don’t. The other thing, of course, is analyst estimates because it’s not just about revenue, is it? It’s also about just what’s happening with that company’s positioning in the market. So, there are a lot of companies that don’t look like they’re going to have huge revenue growth, but analysts love them because a lot of things can happen between now and then.
So, I’m looking at those two things in particular, but the main thing is … I want to know, what is the current price of the company relative to its earnings say in 2023. If it’s ridiculously high, that means that it’s going to take way too long for that stock to get back to where it’s a reasonable investment. So, let’s just rather sell it, take the money and rotate it into something else. That’s the way that the ball bounces.
But I think the key thing is, you have to look at earnings and revenues. That’s not what was happening one year ago, was it? That wasn’t the way people were investing. What was GameStop earning a year ago? I don’t know, probably nothing, but look what happened to its stock. So, is that all over, Clint, or do you think there could be a double bounce in those kind of stocks?
Clint:
I mean, you know what? Look at what have they done since then, I guess? I mean, go look at a lot of the meme stocks and what they’ve done off of that initial surge. I remember for a long time everyone’s screening criteria was just basically based on short interest. It’s like, what stock has a high short interest? Let’s plow into those and see if we can generate a short squeeze.
Ted:
I don’t see that happening right now. I don’t think the retail guys are going to disappear, but they’re not going to drive the market or, if they try, I think they’re going to learn old lessons, old fuddy duddy lessons, pretty quickly.
Anyway, that’s all we got for today, folks. Remember, The Bauman Letter and Bauman Daily are yours to subscribe to. You can click on the link above here or you can click down below if you’d like to subscribe. We’d love to have you on board. It’s risk-free. Anytime within the first year, you’re welcome to get your money back. Anyway, Clint, thanks for talking to me. We’ll reconvene next week.
Clint:
See you.
Good investing,

Angela Jirau
Publisher, The Bauman Letter