
Buying a house and buying a stock have one key thing in common:
You must know what you’re getting, and whether or not the price you pay is fair.
To judge the quality of a house, you have to know about the location … the layout and square footage … and if there are any “landmines” waiting for you. That’s why you get an appraisal and a thorough home inspection.
Of course, with both stocks and houses, there are a trove of “intangibles,” which make it difficult to know precisely the quality of the asset. And that’s before you can even determine if you’re paying a good price.
For that, you can get at a quick-and-dirty valuation of a property by looking at the “price per square foot.” You may know that the zip code you’re shopping averaging $350/sq. ft. … and if you find two comparable houses you’re interested in, one offered at $355/sq. ft. and one at $325 … you instantly know that the $325/sq. ft. house is offered at a lower valuation — it’s a better deal!
Now, you can do the exact same thing with stocks … where the equivalent, quick-and-dirty valuation metric is the stock’s price-to-earnings ratio — P/E ratio, or simply “P/E” for short.
The P/E ratio shows you much you’d have to pay to get access to $1 of the company’s earnings. For some stocks, you may only have to pay $2 for every dollar of earnings (aka P/E equals 2). If the stock’s quality checks out, we might call these stocks “cheap” and a good value.
For other stocks, you might pay, say, $50 for every dollar of earnings (aka P/E equals 50). That’s probably a pricey stock, no matter its quality, considering that the long-term average P/E of the broader market is around 17.
At the heart of it, “value” measures the difference between what you pay for what you get.
If you pay a lot, but only get a little … you’re getting a bad deal. If you pay a little, but get a lot … you’re getting a good deal.
I say this because, for the past couple weeks, I’ve been talking up the idea of buying small, “cheap” stocks that large institutional investors overlook. Specifically, because of an archaic SEC rule that prevent these institutions from easily trading them, stocks trading under $5 per share.
The problem is, despite their price tag, only a few of these $5 stocks are a good value. I would never suggest someone go out and buy every stock trading under $5, because most of them are priced that way for a reason. Some of them should be priced even lower.
You have to dig deeper. But the work required to finding those stocks is well worth it. Because my research shows that finding these stocks, especially right now, could be the key to you catching 500% gains, or more, over the next year.
That’s why today, I’ll show you how I’m uncovering the small stocks with the best value, and how these stocks can provide immense gains even in a bear market.
And I’ll even provide a list of the top potential candidates on my watchlist right now.
Finding the Best Value in $5 Stocks
While a $5 stock may seem cheap, most of them are anything but.
But, there are plenty of “golden needles in the haystack,” as one of my editors put it recently, if you know how to screen for them.
And that’s exactly what we’ve done with my $5 Stocks to Watch list.
On the first screen, we found nearly 300 stocks that trade under $5 per share. Already, these stocks are unique — SEC rules disincentivize major institutions from trading them until they rise back above $5.
So the goal becomes finding the ones that will go up. And to do that, we use the Green Zone Power Ratings system.
For the uninitiated, the Green Zone Power Ratings system uses six factors to rate stocks on a scale of 0 to 100. The higher the rating, the higher the likelihood that the stock will outperform the market by 3X over the next 12 months.
The lower the rating, the more likely the stock will vastly underperform the market.
By far, there are more $5 stocks with on this bearish side of the spectrum than the other, bullish side.
In fact, here’s a quick breakdown…
Breaking Down the $5 Stock Watchlist Scores
The average overall Stock Power Rating across all stocks originally included in the $5 Stocks to Watch Now list is a lowly 24. That’s a firm “Bearish” rating, and communicates clearly just how few of these $5 stocks are worth buying.
But the ones that are … they’re worth backing up the truck for.
The top-rated stocks in the list score a 95 overall. That easily earns it a Very Bullish rating, and strong confidence from me that the stocks in this tier will outperform in the months ahead.
To bring it back to value, the average Value rating in the original list is 38. This, in a way, shows that the broader market is still overvalued, even after enduring a bear market since the start of 2022. For instance, while the price-to-earnings ratio of the small-cap Russell 2000 index was a nose-bleed 63 a year ago, it has only come down to 33 today, which is still “rich.”
But once my team and I whittled down that Watchlist to only the top-rated stocks … the average valuation rating jumped to 87 out of 100.
In short, these $5-per-share stocks are trading at incredibly favorable valuations — they are cheaper than 87% of all stocks available in the market today.
This just shows the importance of being selective with your investments and knowing that the price you pay for a stock — the valuation you pay — matters greatly to your future returns.
We’re in a bear market, facing a likely recession and may not have seen the last of high inflation…
And with broad-market valuations still above average, I don’t think you’re doing yourself any favors if you simply buy a stock index fund and call it a day.
I cannot stress this enough… When you hear that you should buy “small stocks” in a bear market or recession, that does not mean you can buy any small stock.
Yes … generally speaking, small caps post higher returns in the aftermath of a bear market. But there are so many stocks that won’t make it … and might even fall to zero.
That’s why I’ve spent so much time these past few months finding the very best small, high-quality companies that are actually trading at cheap valuations. This way I know we can not only beat the overall market … but absolutely smoke the small-cap sector itself.
And when you pair my potent “size, quality and value” analysis with the SEC’s $5 rule, encouraging major investors to only buy stocks once they cross above $5…
We have a killer system for finding the biggest winners of the future bull market.
If you aren’t already, I highly encourage you to follow along with my latest revision of the $5 Stocks to Watch report. I’ve already removed all the stocks in the “high-risk” category. And the next iteration of this report will include only the 38 stocks that pass my system’s initial screen and are worth a closer look.
These stocks have the greatest potential to generate market-trouncing returns over the next year or so.
To good profits,
 Adam O’DellChief Investment Strategist, Money & Markets
P.S. One more thing to mention…
Next Thursday, I’m releasing the third and final version of the $5 Stocks to Watch Now report.
From what I’m seeing, this revision will only contain a few dozen stocks. Each of them scores highly on my Stock Power Ratings system.
The same day I release that report, I’m going live to discuss the best of the best stocks within the few that remain. I’ll soon be recommending these stocks to my subscribers, and I’ll share details on how you can join them at the event.
If you want to secure your spot and ensure you receive the final list of $5 Stocks to Watch Now, click here.

8 Out of 10 Indicators Point to a Recession
Our colleague Mike Carr has called our current situation “the most anticipated recession in history.”
And after mulling over this week’s release from the Conference Board, I really can’t disagree.
The Conference Board just updated its index of leading economic indicators. It’s a collection of economic data points that have historically been accurate in predicting recessions.
Among several other factors, it includes average weekly hours worked in manufacturing, weekly initial jobless claims, building permits for new construction and the level of inversion in the yield curve.
Well, the index dropped 1.2% in March and has now been in decline for a full calendar year. And the drop is actually accelerating.
From October 2022 to March 31 of this year, the index dropped at an annualized rate of 8.8%. This compares to a rate of 6.9% from April to September in 2022.
So there’s no mistaking the direction, eight out of the ten indicators that make up the index are pointing lower.
And since this data goes only through March, any effects of the banking mess that started last month likely wouldn’t be reflected.
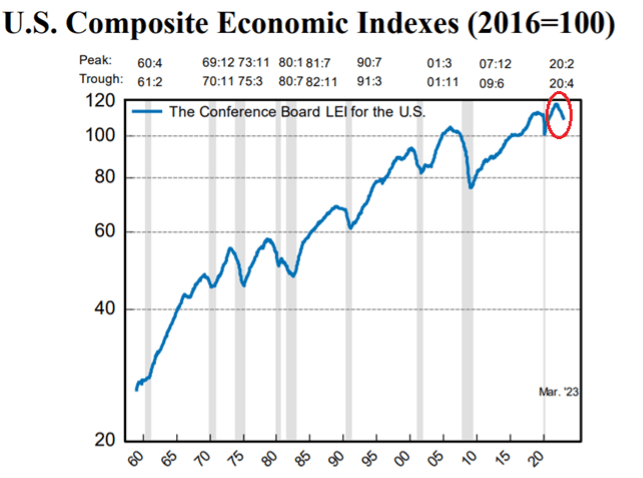
As you can see in the graph above, the leading index has been a good predictor of recessions over the years. The blue line starts to point lower shortly before the shaded areas that indicate a recession.
Sometimes the lag is a little shorter or longer than others. But there has yet to be a case where the index dipped meaningfully lower, and we didn’t get a recession that followed … with the lone (and debatable) exception of the 2020 recession during the COVID pandemic. (It was over almost as quickly as it started, and had its indicators wildly skewed by the lockdowns.)
Meanwhile, anecdotal data seems to back up the notion that a recession is on its way.
New jobless claims rose from 240,000 to 245,000 over the past week. And the number of people collecting unemployment benefits jumped by 61,000 in the week ending April 8 — to the highest levels since November 2021.
Tesla, one of the darlings of the COVID era go-go market, reported its operating profit margins. They dropped by 11% as the company deals with the aftermath of slashing its prices.
I could go on, but you get my point.
Now, a mild recession isn’t the end of the world. Yes, it likely means lower profits across the board, and if history is any guide, a stock market that is sluggish at best for the next several months.
But a recession would also help ease inflation and reduce the pressure on the Fed to keep raising rates.
In any transitional economy like this, there will be winners and losers. And if you’re looking to find some of those potential winners, I mentioned yesterday that Adam O’Dell has a special presentation coming on April 27.
He’ll help you find the best stocks under $5 that are getting ready to soar — for up to 500% gains or more in the coming years. Reserve your spot today so you can find out more during the free webinar!
Regards, Charles SizemoreChief Editor, The Banyan Edge