


I can still vividly recall hurrying to the doctor with my toddler. He’d tumbled off the top of a slide and come limping up to me with a badly swollen ankle.
The doctor listened intently to our story while checking the ankle’s range of motion and applying pressure to determine sensitivity and pain.
But despite having a firm grasp on the likely diagnosis, he refused to draw his conclusion until reviewing an X-ray.
Well, just as a doctor relies on images of internal structure to make a final diagnosis, so should investors before making decisions in the stock market.
It’s easy to track the performance of a major index like the S&P 500. But it’s dangerous to diagnose the stock market’s health without first ordering an X-ray.
Here are a couple imaging techniques you can use to gauge the overall health of the stock market (something I do weekly for my Flashpoint Fortunes subscribers).
What the Health Check Reveals
Last week, I outlined the factors that will keep leading the wild swings in the stock market.
Diagnostic tools will help me and you stay one step ahead of those swings … plus profit from the move in stocks.
Here are the X-rays I’m watching, and what they tell me about the health of the stock market.
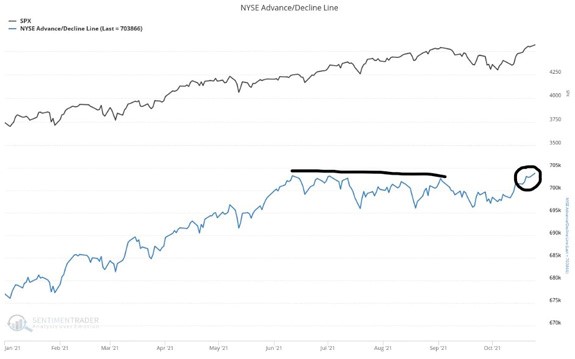
- NYSE Advance/Decline Line. This is a running tally of how many securities on the New York Stock Exchange are gaining versus declining every day. Think of it as the performance of the average stock. A great sign of health is when this indicator is leading stocks higher. After lagging badly during the summer, the line is now moving out to new highs. That’s a bullish sign for stocks.
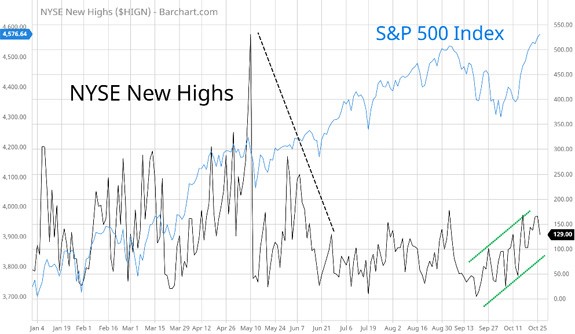
(Click here to view larger image.) - New Highs. When the stock market is making new highs, a growing number of stocks should be hitting new highs as well. This was another warning sign heading into the summer. The number of new 52-week highs on the NYSE plunged as the S&P 500 rallied, as you can see below. Now recently, the number of new highs is expanding again.
(Click here to view larger image.)
Signs of a sickly summer finally gave way to a 5% pullback in the S&P 500 last month. But the recovery since then is close to delivering a clean bill of health.
One way to take advantage is to…
Focus on Breakouts
Part of the reason why the summer months were difficult for traders is because many of the best-performing groups coming out of the pandemic were extended on price momentum and in much need of a break.
That created a choppy, directionless market for many sectors. But as I showed you above, there are signs that these consolidations are completing, and the uptrend is ready to resume.
I’ve got my eye on two exchange-traded funds (ETFs) in particular that are ready to break out. One is with small-cap stocks and the iShares Russell 2000 ETF (NYSE: IWM). The other is with renewables and the iShares Global Clean Energy ETF (Nasdaq: ICLN).
So, get ready to profit from the stock market’s clean bill of health, and do so with these ETFs that are emerging from their slumber.
And by the way, it turned out my son’s ankle was only badly sprained.
Best regards,

Clint Lee
Research Analyst, The Bauman Letter


