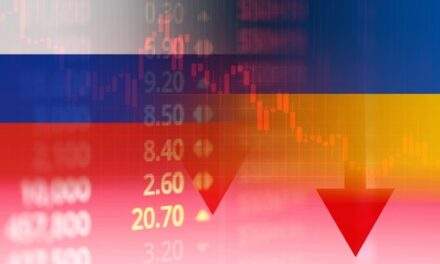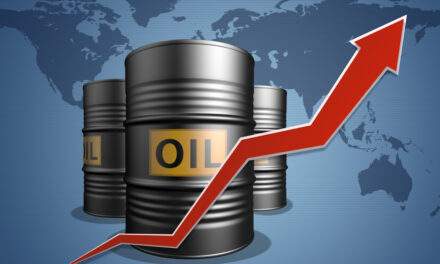

Gas prices are going up all over America, but there’s a practical solution to save your wallet.
In this week’s episode of Your Money Matters, Ted and Clint deliver a quick overview of the entire energy sector, including a few whose gains could help you beat rising costs and prepare your portfolio for the threat of stagflation.
Click here to watch this week’s video or click on the image below:
Transcript
Ted:
Howzit, everyone? This is Ted Bauman, here, editor of the Bauman Daily, which is about to undergo a rebranding exercise. Personally, brands, what’s a brand? A brand is what we give you but the name does matter and we’re going to be changing it soon to reflect our focus. And don’t forget our focus is we look at the big picture, in order to find opportunities to make big profit.
Clint is here with me today. We’re going to be talking about commodities. And let’s start by looking at the comparison between investing in different categories of assets. Here’s a chart that shows, just roughly speaking, a couple of the different major categories.
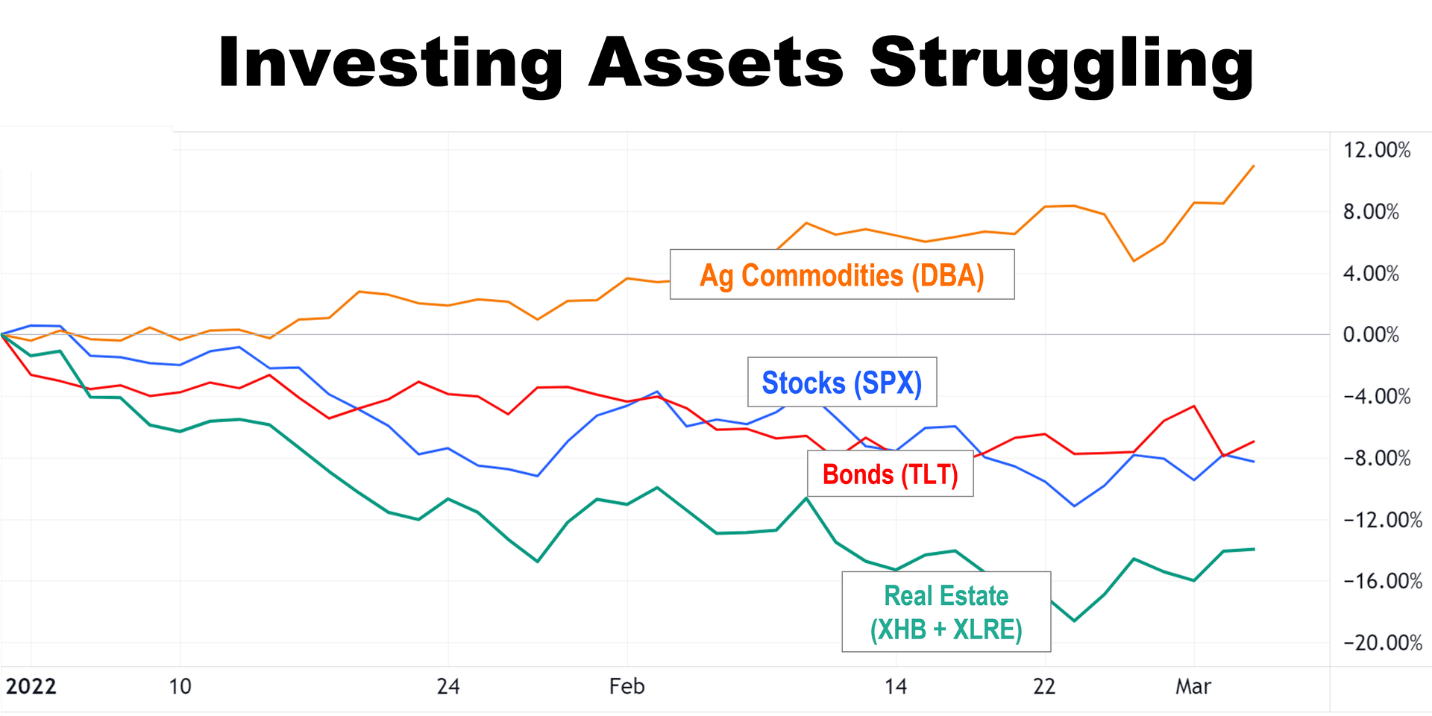
At the bottom, real estate down big time, bonds are down, the stock market is down. Look what’s up: agricultural commodities up nearly 12% since the beginning of the year.
The next chart shows something that isn’t up.
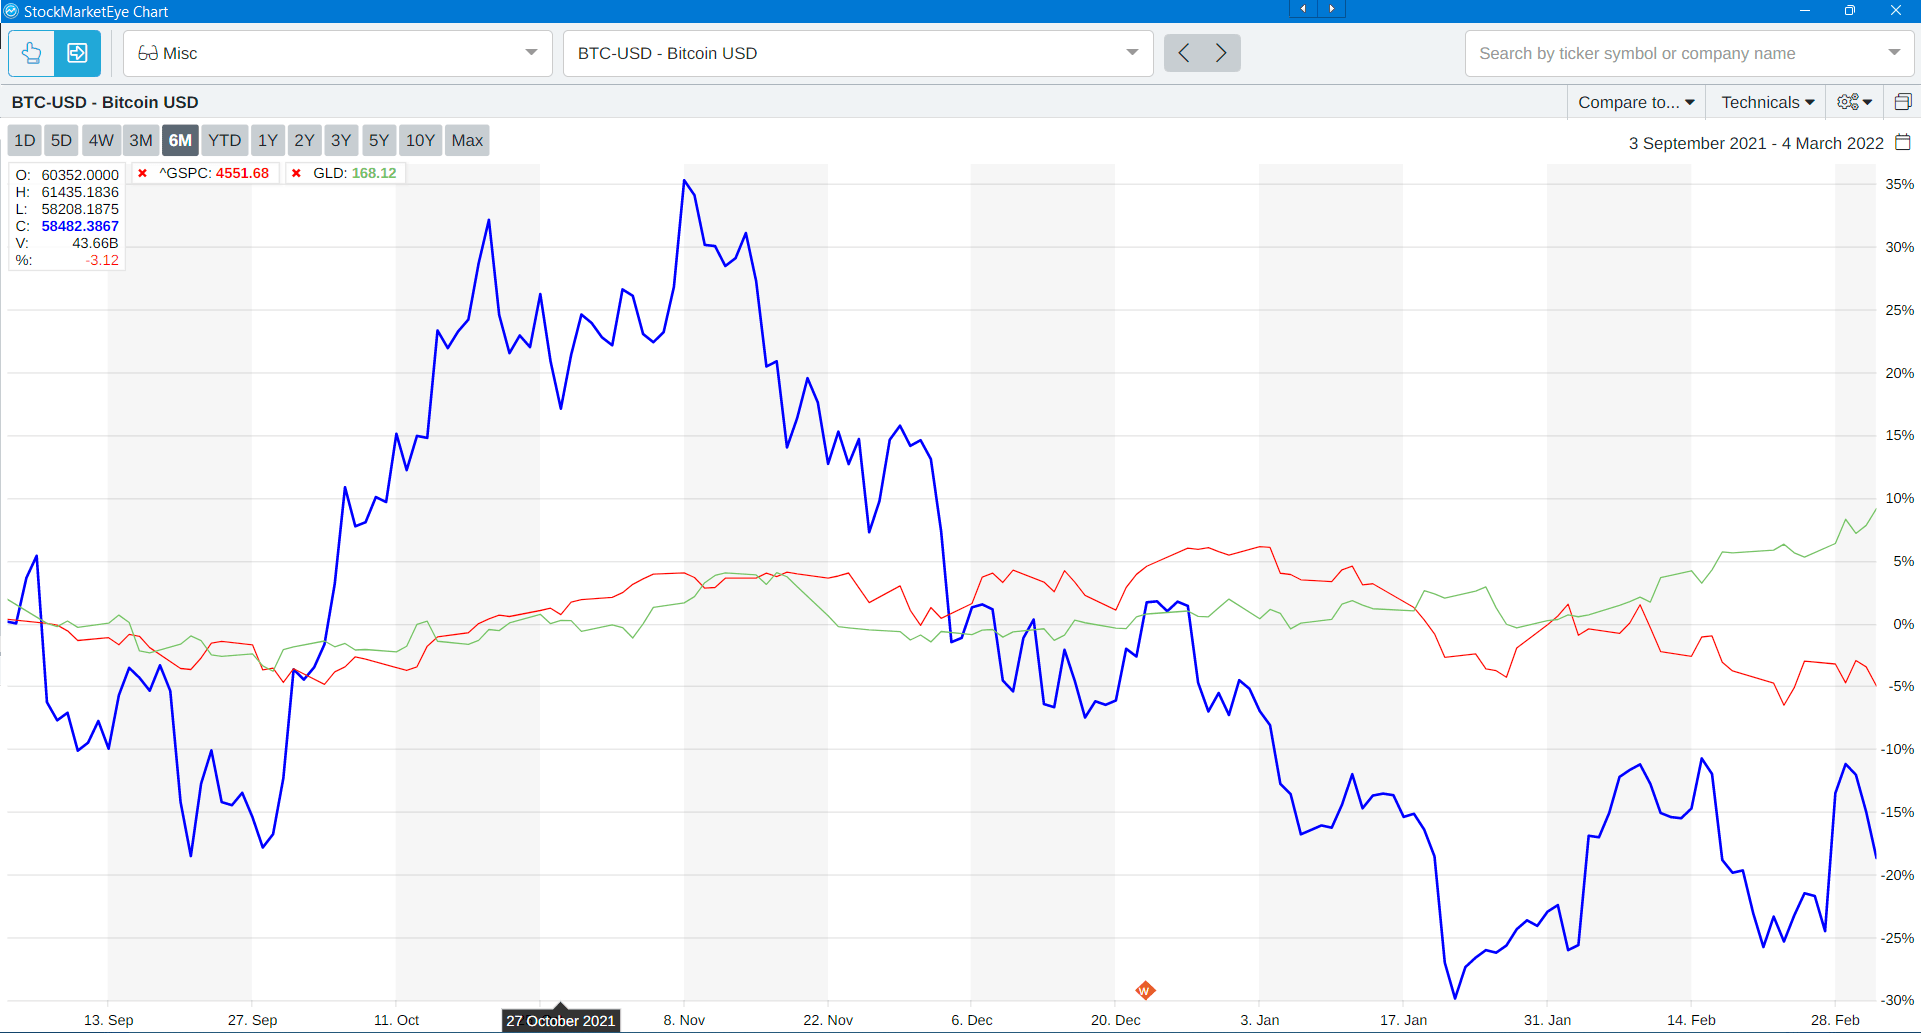
And it’s something that I keep teasing the people who love the stuff, but crypto is not turning out to be a safe haven asset in this environment. Instead, it’s that green line gold. Gold is still the safe haven of choice and that’s probably going to continue to be the case. I still believe that, ultimately, crypto is a correlated asset and that means it’s going to go down when stocks go down now.
The next chart shows DBA, the Invesco DB Agriculture.
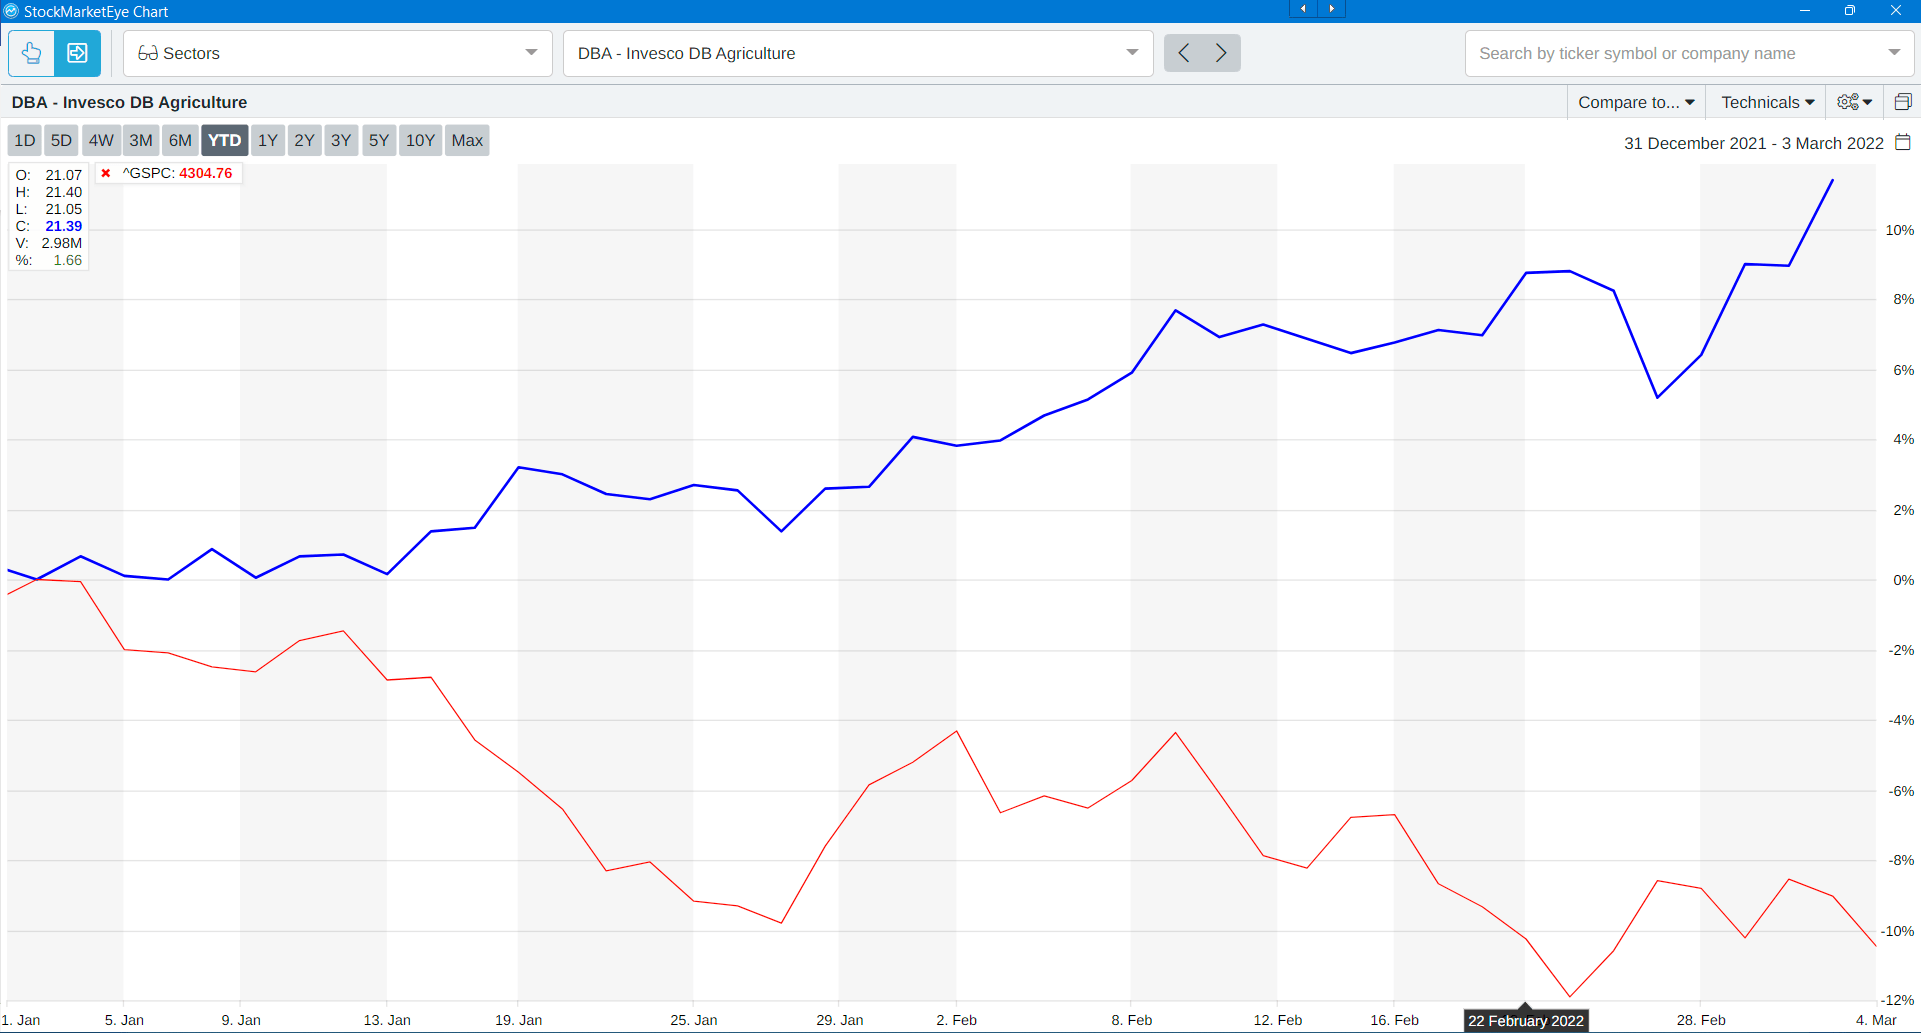
Since the beginning of the year, the ETF, you’ve just blown the market away if you’ve invested in agricultural commodities. But also metals. Here’s a chart that shows what’s going on in the metals area.
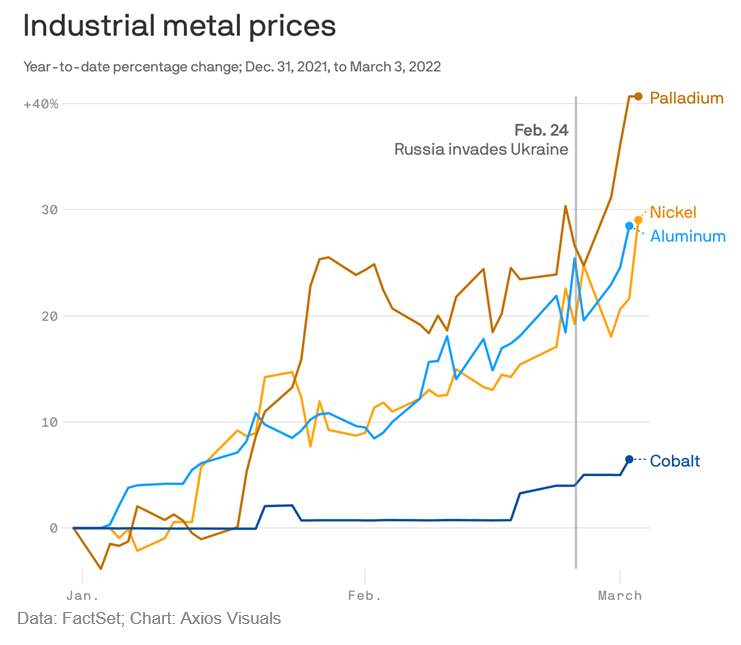
I’ve been talking about palladium a lot and we have a couple of holdings in the Bauman Letter and in our Profit Switch portfolio related to that, and they’ve done very well since the beginning of the year, but also nickel and aluminum. Cobalt starting to tick up because Russia is the second biggest producer after the DRC Congo.
Finally, oil. Here’s oil.
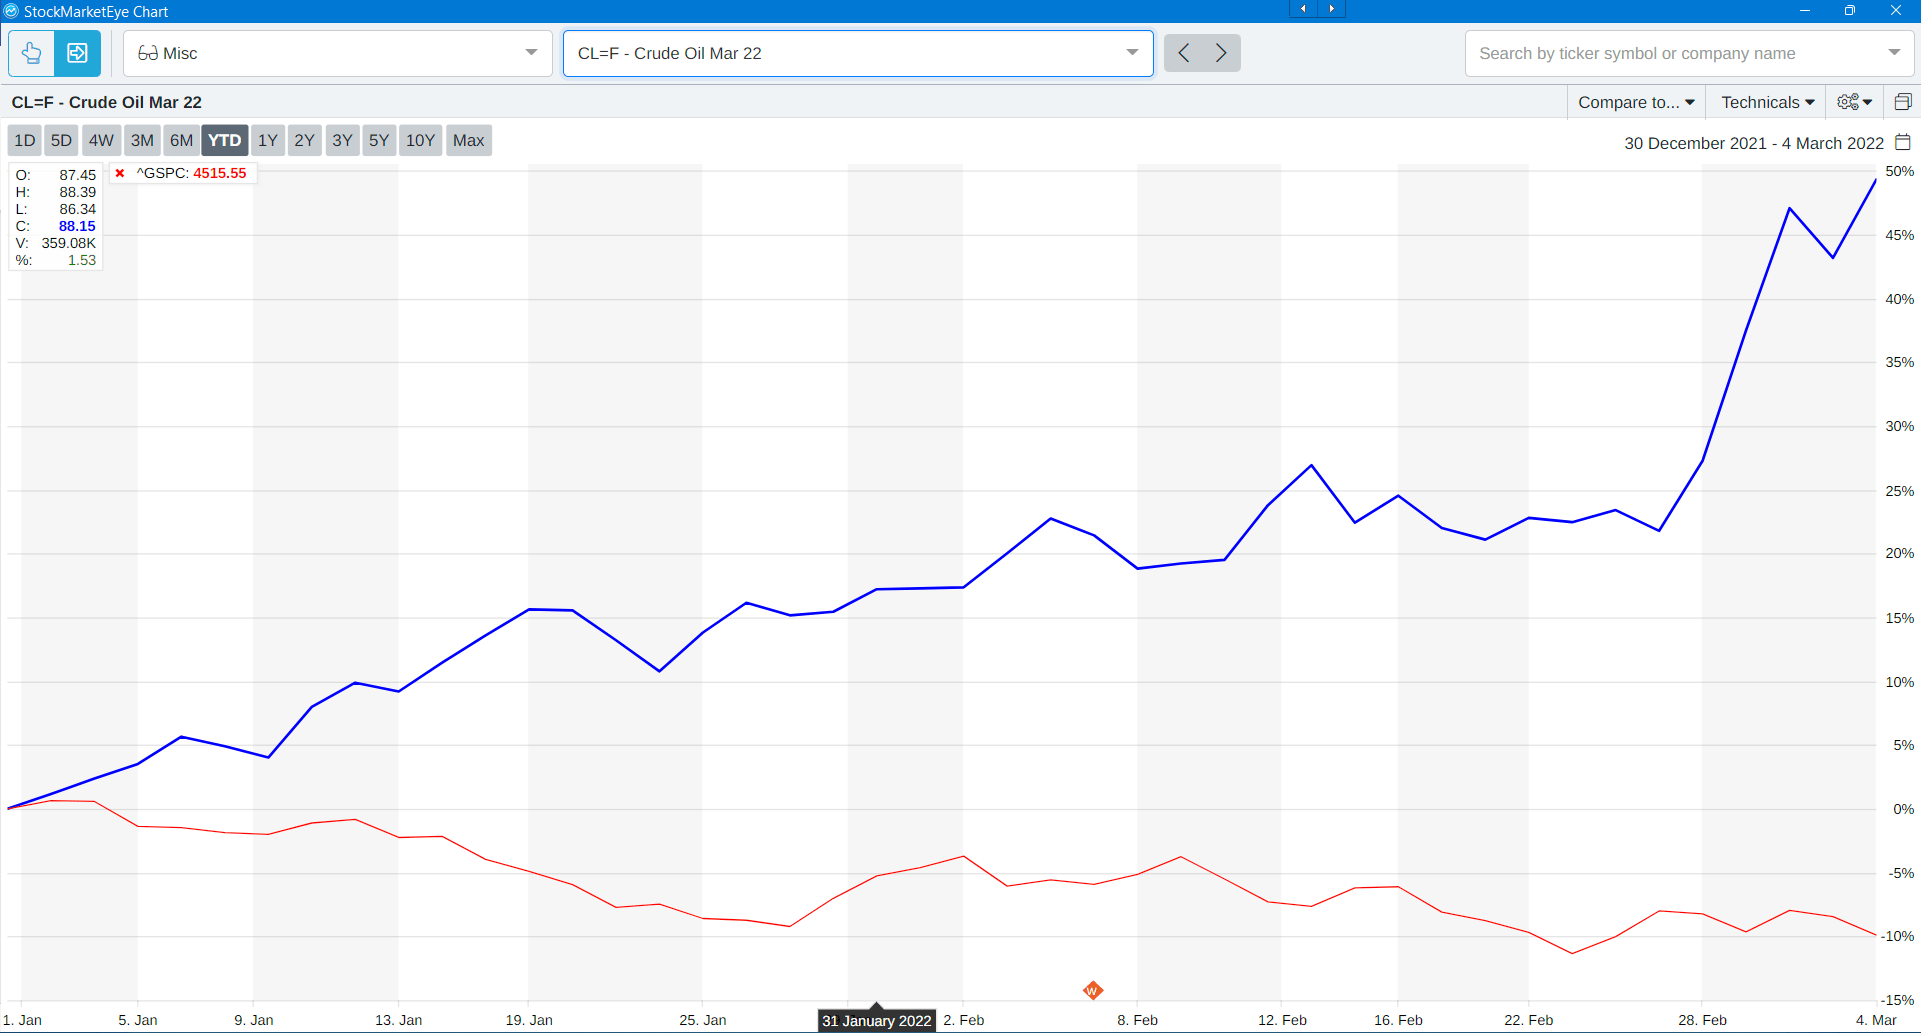
Whoa, look at that. That’s not something you want to see. This is crude oil futures. Huge spike. They were trending upward, but a huge spike since the beginning of the year. Now here’s the thing. I’m going to show you a chart next that shows what happens when you get an increase in oil price inflation or, basically, when the oil price goes up.
This is from Goldman Sachs and it shows that when you have a 10% increase in oil prices, this is what happens to core inflation and producer and consumer inflation, they go up a lot.
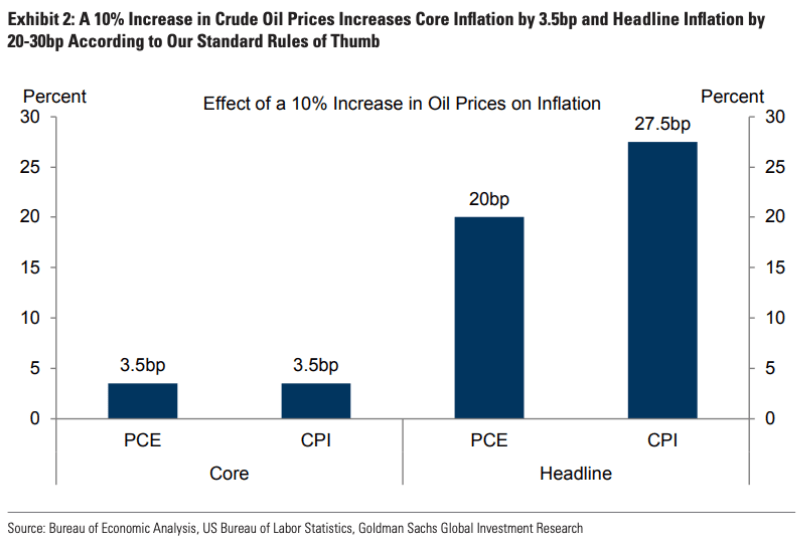
So oil is obviously a big factor in inflation expectations going forward. And what Goldman Sachs is saying, and I find this interesting because it kind of relates to the bind that the Fed is in, is that the only way that you can keep oil prices in some kind of limit is to let them rise high enough that you have demand destruction, which means people don’t buy as much of it because it’s getting too expensive. That means usually a recession. They’re saying it needs to get down to $120 a barrel in order for that to happen. And again, the Fed can’t do anything about that. That inflation is not driven by interest rates or anything else. It’s driven by a scenario that faced this man when he was president.

Yep. That’s Tricky Dick, Richard Nixon, back in the early seventies.
So a lot of what we’re looking at today, Clint, I think you could say that we’re in a similar situation to the way things were in the early seventies. We have a demand side shock in the form of energy that Russian energy supplies are disappearing from global markets, even without sanctions. Stocks are down, inflation is up.
Here’s a chart that showed what happened in 1973, ’74.
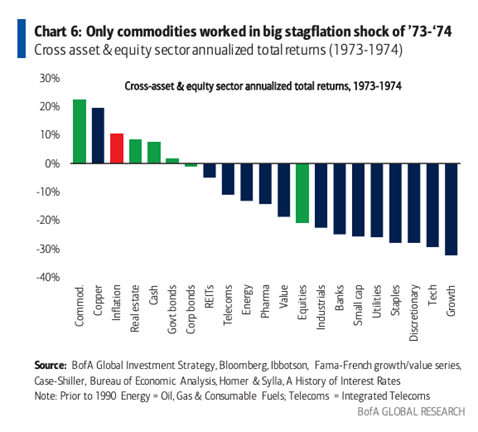
Look, the only things that actually rose and beat inflation were general commodities and copper. Those two. Everything else fell below the rate of inflation, even energy, although that’s very different from now.
But Clint, we’ve been talking about prospects for energy under the current circumstances. Tell us about that.
Clint:
Right. And I had a quick question for you, actually. The point you’re making on oil getting up to a certain level, the main destruction sets in, does that cause recession? Does that maybe imply that… everyone’s talking about stagflation. Does it ultimately just become a self-fulfilling prophecy from that standpoint?
Ted:
Well, again, this goes back to some big structural differences between the way the economy’s organized now and then. Back then, labor had a much stronger ability to anticipate wage or price increases and to bake them into union contracts, which covered a big chunk of the economy. We don’t have that anymore. We do see upward pressure on wages now that’s coming from shortages of labor, but it’s not as though you get people who can go into a negotiation with an employer and say, “Well, we want you to give us inflation plus 3% next year or else we’re going on strike.” Doesn’t happen anymore.
So even if there are expectations of inflation, I don’t think there’re going to be as runaway as they were back then. There are some companies that will try to increase, and can increase, their prices to cope with increasing input costs, but not all of them. I think we discussed that a couple weeks ago in one of our YMMs or Your Money Matters. And so if they’ve got a moat and they can increase prices, they will, but there’s also the long term to consider. You don’t want to piss customers off.
Clint:
Right. Right.
Ted:
So I think there’s that, as well.
Clint:
Yeah.
Ted:
So tell us about energy. What are we going to do with energy?
Clint:
Yeah. I mean, there’s obviously you’re drawing kind of the parallel to talking about the 1970s era and what energy and how commodities perform back then and with what you’re seeing today.
But the first thing I wanted to start with, on the energy side, excuse me, is to actually look at how production of different energy types has been trending just in the U.S. over the long term here.
So just looking at where energy projections are going for natural gas, natural gas liquids in the oil sector.
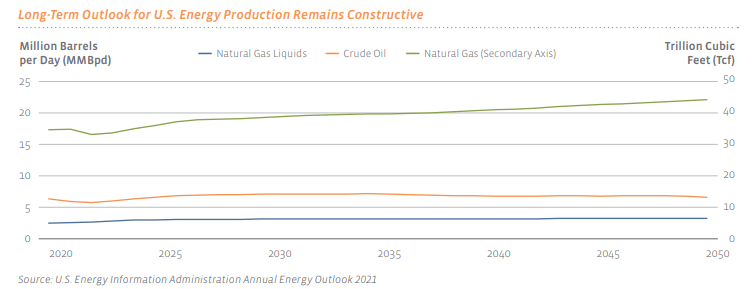
And what you can see is this is a long-term projection from the U.S. EIA, starting in 2020, going all the way out to 2050. And what’s interesting is that if you look kind of in the middle of the chart on oil, oil is the orange line on here, oil just kind of levels off. Oil production doesn’t really go anywhere, to a big extent from where we are today.
But where you really start to see some of the gains come in is in the natural gas space. Natural gas goes from running today around 17 trillion cubic feet projected out to 45 trillion cubic feet. And so just having those numbers in mind, I think then it’s also interesting to look at how we’ve moved from being, just across the energy complex, an overall net energy importer to now a net energy exporter. It’s just a big change from where we’ve been.
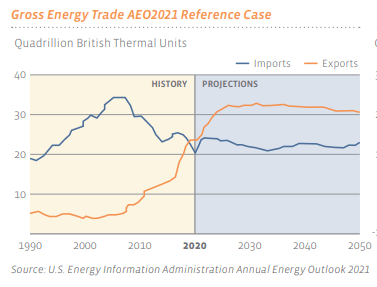
So, here’s a chart going back to the 1990s, the blue line on here is, once again, is across the energy complex. Our energy imports versus the orange line being our energy exports. And you can see we’re in a large net importing position. And then you get to about 2020 and you start to see that trend change. We go from being a net importer to a net exporter of products. I mean, just since 2010, you’ve seen exports jump by over 2X and out to about 2030, you’re getting another 30% bump by the end of the decade. And so just looking… so we’re seeing our production levels go up, we’re seeing demand for U.S. energy exports, and now what we have is the bump in prices that you were alluding to just a moment ago with those charts.
Ted:
Right. So basically what you’re saying is that we have changed from being a net energy importer to a net energy exporter since the 1970s. And so we can expect that energy column in that chart that I showed earlier actually to be on the positive side. Now that’s cost people, right? I mean, we don’t like to see higher petrol prices, higher gas prices, heating oil, natural gas, but it’s going to happen anyway. But what can you do to beat it? I mean, if you can’t beat them, join them. How are we going to join them?
Clint:
That’s right. You’re going to feel the pain at the pump but take the opportunity to maybe turn that into some income. Because with the higher prices, coupled with those rising production levels, you’re going to see some absolute, just profit windfalls, for certain energy companies over the next couple years.
One company in particular I was reading about; an analyst comments this morning on EQT. And they were noting that if things stay the way they are, that company could generate more than its market cap and free cashflow just over the next three or four years, so-
Ted:
You heard that, EQT folks go have a look!
Clint:
Yeah.
Ted:
Now but before you go on, I just want to distinguish one thing. We know that there is a lot of headwinds against capital investment in fossil fuel production, right? I mean, it’s not a popular thing to do, irrespective of where we are right now. So even if there’s some reluctance on the upstream side—the producers—tell us about the midstream, because those guys make money no matter what’s happened, right? How does that work?
Clint:
Yeah. So, I mean, the midstream guys, they’re, they’re more involved in moving energy around whether it’s oil, net gas-
Ted:
Right.
Clint:
Then you get downstream coming into play with more of the storage and refining. But on the midstream side, yeah. I mean, they’re basically collecting their toll to ship this product, similar to how REITs collect rent and that’s translated in some nice dividend yields. So actually, here’s a chart from Alerian.
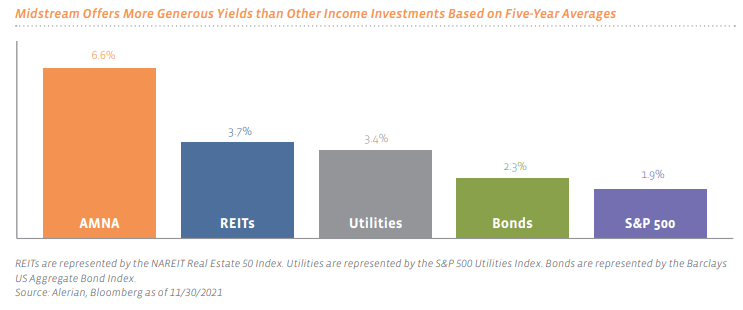
This shows… so on the left-hand side where you see that AMNA, excuse me, that’s Alerian. That’s their midstream index. And this is the dividend yields on that index, compared to the other categories on here.
Ted:
Hmm.
Clint:
You see our favorites REITs… or one of our favorite REITs is at 3.7%, utility is at 3.4% and so on. So you can get a really nice yield out of the sector. Now, one thing to be aware of, is the volatility that you have in the energy space before you go saying, “Oh, I’m going to shift my REIT allocation, my utilities, or bonds over to midstream energy companies.” It can be a volatile space. They suffered a lot of underperformance going back to 2010. But once again … they do distribute income. We’re starting to see some of those trends change and so I think there’s some good opportunities to start looking at, for example, these midstream companies here right now.
Ted:
Right. In a way, a midstream being the pipelines and the distribution facilities are kind of like shipping, right? I mean, we’ve seen shipping stocks go ballistic over the last year and we’ve also seen them pay out some enormous dividends. I mean, we’ve got a couple in our portfolios that are paying well in excess of 10%. These are special dividends, they’re not going to carry on forever. But you can actually make a lot of money on them. But there’s one dreaded thing that a lot of people get scared of: these midstream companies tend to be organized as Master Limited Partnerships. What’s that about? Do we need to worry about it? What’s a dreaded K-1 Form?
Clint:
The dreaded K-1 Form can complicate your tax life. And the other thing I want to highlight, too, is that there’s just so much unique circumstances, nuances, in that space in terms of what basing, production basing, you have exposure to versus who your customers are versus where you source other energy production. So there’s a lot of nuances to know in this space and, coupled with the tax issues, that’s why I think it’s good to look at an active manager … or an ETF. In this case, though, I would prefer to look at more of an active manager who is taking advantage of the rules and circumstances to avoid K-1 issues and, at the same time, they know the companies in the space.
And to that end, one of the funds that I’ve been looking at here recently is TYG, which is a Tortoise Energy Infrastructure.
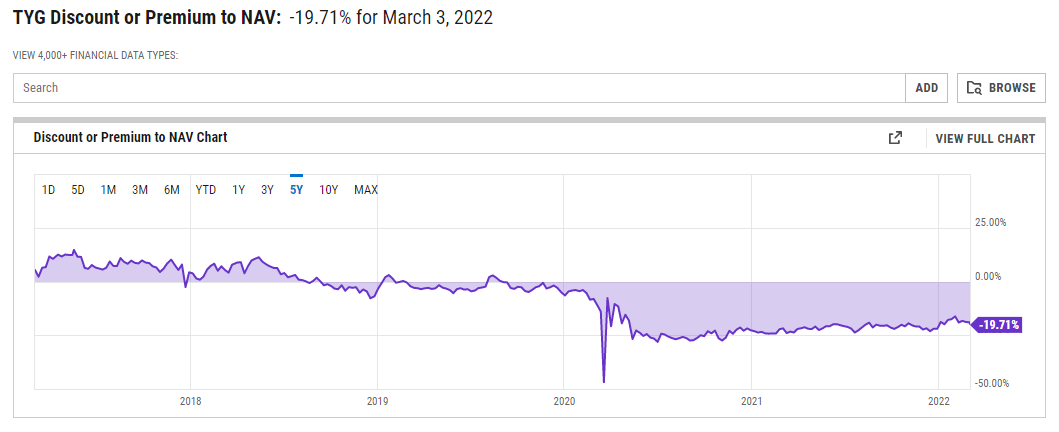
It’s a closed-end fund. And you wouldn’t know just by the name but I think what’s interesting about this fund, once again a closed-end fund, is they have about 45% of the portfolio in natural gas infrastructure. They have another 45% of the portfolio in renewable energy.
Ted:
Mm-hmm (affirmative).
Clint:
Now, we talked about that. You talked about that in your Friday video this past week, to where this energy crisis, it’s spotlighting the need to accelerate renewable energy investments to reduce dependence on sourcing your energy elsewhere. But that doesn’t happen overnight. I mean, that is a long term trend. It’s going to take a decade plus to get there so you need to bridge the gap. And one way you get there, I know we’ve been spotlighting, is with natural gas and liquified natural gas. And so I think it’s interesting you get exposure to both of those areas. With this fund, a 9% distribution rate trades at about a 20% discount to NAV.
Ted:
Right. And of course, discount to NAV is critical because you always want to try to grab a fund like this when it’s trading at a discount to NAV. What that means is that the price of the fund is less than the actual market capitalization of the stocks that it holds, which means that this is an excellent way to play this.
But as you were saying, remember, this works both ways. If there’s a resolution, this could change. But in the short term, if you’re looking for big yields, this is one way to go.
Well, there you have it, folks.
Basically, the energy scenario is like the 1970s with the big difference that the U.S. is now a major exporter. What we’ve given you is a way to play that doesn’t get you into the production side, which is more dodgy going forward, because the renewables gets you into the pipelines and pipelines are a good place to be. Anyway, that’s all from us this week. We’ll talk to you again next week. Take care.
Good investing,

Angela Jirau
Publisher, The Bauman Letter
Curious how AI will play a role in the energy sector? Click here to read Ian King AI energy coverage.