“Collapse” is the most frightening word in any investor’s vocabulary.
It refers to a steep and sudden decline in stock prices much larger than the standard -20% definition of a bear market.
Fortunately, such collapses are rare. But they all have one thing in common: liquidity — the presence of willing buyers — evaporates.
In today’s video, I explain how these dreaded events occur … and what to watch for when one threatens.
Transcript
Hello everyone, it’s Ted Bauman here, editor of The Bauman Letter and Bauman Daily with your weekly Friday video. Sorry, I missed you last week, but I had just arrived in South Africa and things were … shall we say a little disjointed because my bag was late and we had a few production issues on this side because of that, but I’m back to normal. This is my South African office. You can see it’s a little different, not quite as fancy, but I am down here working on my house. Anyway, today I want to talk about the one thing that you need to look out for if you suspect that a stock market crash is on the way. I’ve chosen that not because I think that one is on the way, but because they have occurred regularly in history and one of the most common questions I get as a Bauman Letter writer and as a financial journalist is, “What causes crashes? When might it happen? How do we know if one is coming?”
So, I thought today I would review that. Let’s start by looking at the background to crashes and what has happened over the course of many, many years. Well, here’s a list of stock market crashes:
- Panic of 1907 — stocks fell by 20% in one day.
- The Wall Street Crash of 1929 — Dow dropped 25% in 4 days, eventually losing 90% of its value.
- Crash of 1973-1974 — S&P 500 lost 50% of its value.
- Flash Crash of 1987 — Dow shed 22% in one day.
- Dot-com Crash of 2000 — Nasdaq declined by 40% over 2 ½ years.
- Subprime Crisis of 2008 — S&P 500 fell by over 50% over 2 years.
- COVID crash of 2020 — S&P 500 fell by almost 35% in one month.
A crash is typically defined as a fall in the value of the stock market. More than 20% which is the technical definition of a correction or sorry, of a bear market. It’s when it happens in a matter of a short period of time. In other words, when it happens over even a couple of years, but sometimes it can happen in just a couple of days. So let’s look at the list here. The Panic of 1907 stocks fell 20% in one day. Wall Street crash of ’29 eventually lost 90% of its value over the next couple of years. The crash of ’73, ’74 the S&P lost 50% of its value during those two years. In the Flash Crash of ’87 the Dow shed 22% in one year. The Dot-com crash of 2000. The Nasdaq declined by 40% over two and a half years. The subprime crisis, the S&P 500 fell by over 50% over two years. Finally, the COVID crash, the S&P fell by 35% in less than a month. Now here’s a chart of the Great Depression, it shows the crash:
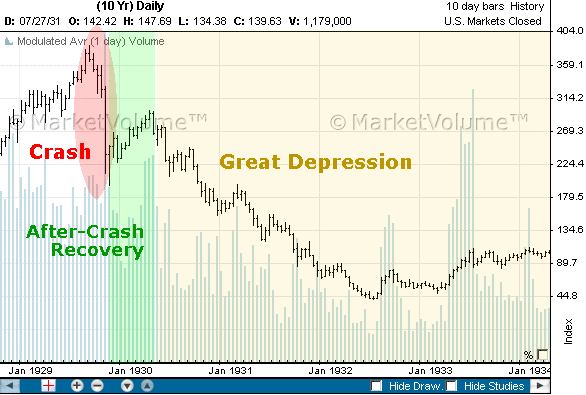
Now, one of the things about crashes, you see that the crash occurred in October of ’29, but then the stock market began to recover. It tried to recover during 1930s. So a lot of people have the impression that it was one and done, but it wasn’t. But the key thing is that the market continued to fall before eventually reaching a bottom in 1932. Now, the reason why that’s important is because sometimes crashes come and go like the Flash Crash of ’87 or the Great Panic of 1907. They were over relatively quickly. But in other cases, they lead to long-term bear markets.
Now, what’s the driver of all of this? Well, the key thing is the absence of, or the withdrawal of liquidity. Liquidity is simply the presence of willing buyers in the market. What tends to happen in a crash is that institutional sellers have decided to liquidate their positions for whatever reason, leaving only retail sellers holding the stocks. When they realize that the institutional buying power has left the market, they too begin to try to sell. Because it’s a less liquid market in other words, fewer sellers … price movements tend to become exaggerated and tend to fall very rapidly. Now that’s not always the case. The Flash Crash of ’87 is supposed to have been about electronic trading gone awry. But in most cases what happens is withdrawal of liquidity, even in ’87 that’s what happened. It was just that the withdrawal of liquidity happened very quickly for systemic reasons.
Now, what’s the big threat? What is the thing that tends to cause a glitch in the markets turning into a crash? Well, the main thing is increasing credit risk. Now the stock market is part of the financial system, so is the lending system. One of the most important parts of the lending system is corporate debt. Corporate debt is typically one of the biggest elements of debt next to the government and the household sector. Particularly what tends to happen in periods of financial instability is that you begin to see the spreads of yields between low- or high-risk corporate debt and safe debt like 10-year Treasury bonds. You begin to see those yields increase. So, the key thing is that if you are in a situation like we are now, whereas I’ll discuss in a moment, interest rates are going to rise. Then one of the big things to look out for is what’s happening with corporate credit spreads. Well, here’s a chart that shows the measures of corporate credit risk, which includes the spread:
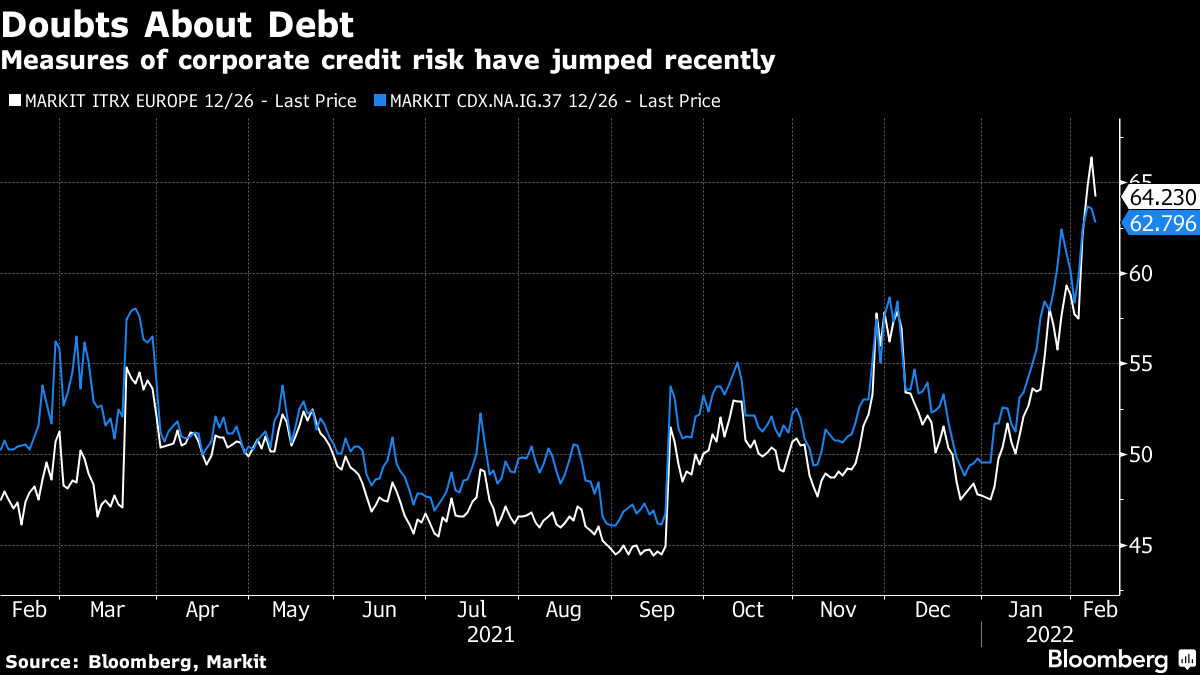
This comes from a market in Bloomberg. It shows that since the beginning of this year, concerns about the safety of high yield corporate debt have risen very substantially. The next chart shows how ETFs which own or expose investors to corporate debt have fallen actually by more than the S&P 500:
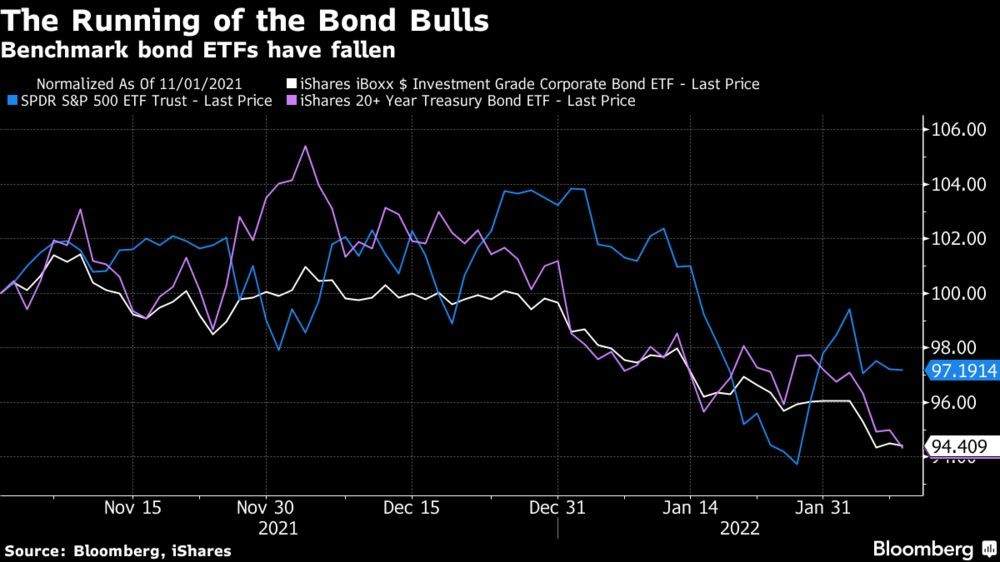
Even though the S&P has rebounded a bit in the last couple of trading sessions, that hasn’t been the case for these corporate bond ETFs. So that’s one of the critical factors right now is that there seems to be nervousness about corporate debt in the market.
Now, that’s important because corporate debt is obviously linked to companies. Many of which are listed on the stock market. When companies start running into trouble servicing their debt, either it’s because they’re not making much money or interest rates are rising or something like that, then you can very easily see a credit crisis where essentially the market begins to fear the prospects for these companies. Then they refuse to reinvest as companies roll over their debt. Remember most corporate debt is on a two-year rolling basis. Companies issue bonds, investors buy the bonds. The bonds are then redeemed in two years’ time, and then they issue new bonds and new buyers roll them over. When that doesn’t happen, that’s when you get big credit crises.
Now, the context we’re in right now is the interest rates have been extremely low for a long time and that has led companies to borrow more than they would otherwise because all things being equal, the price of money is very low. You’re going to consume more of it and that’s what credit essentially is. Well, here’s a chart that shows the long-term trend:
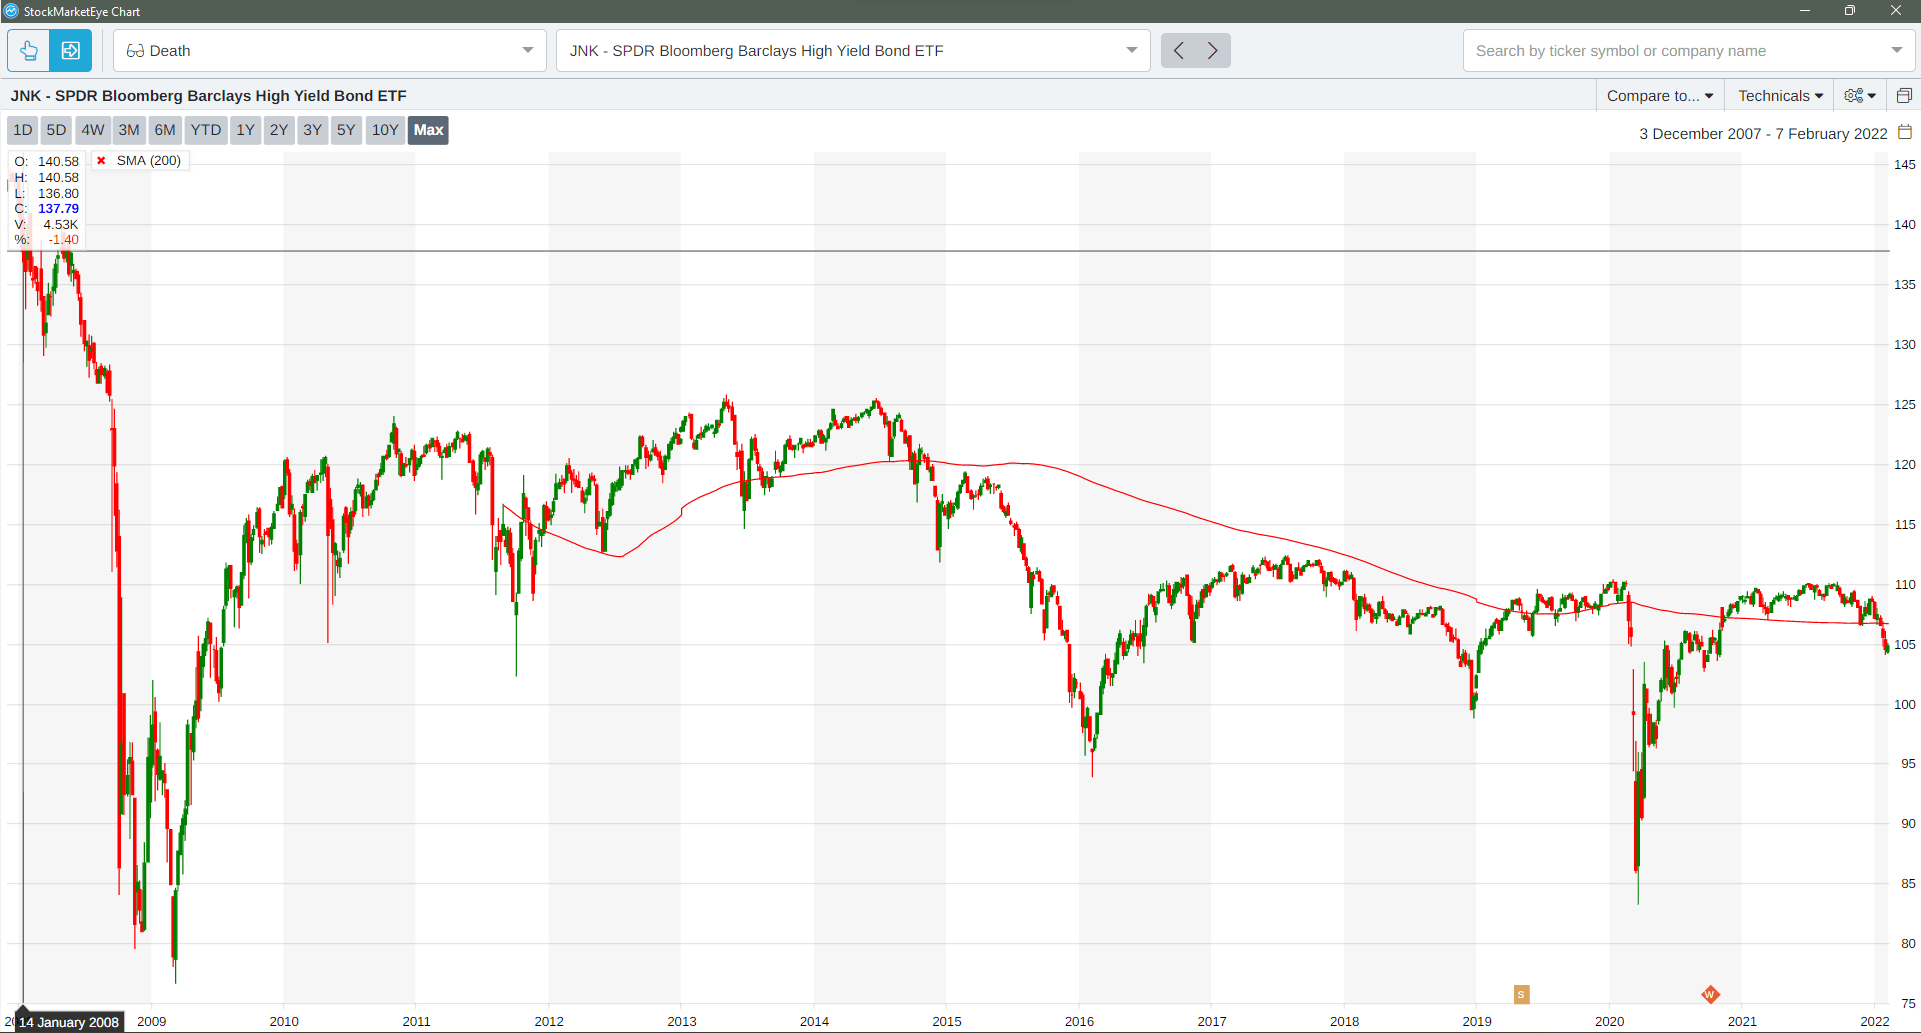
Again, this is looking at the Barclays High Yield Bond ETF. Essentially what’s happened is that over time, the concerns about corporate health have basically been fairly stable since the 2008 crisis. Bond spreads used to be a lot higher. Junk bonds used to yield a lot more before the financial crisis, but very low interest rates have led to a decline in those yields because basically the even risky companies can borrow cheaply when easy money is there. So that’s why I’ve included a trendline. You can see that it has fallen since the 2008 crisis.
Now, “Why did interest rates fall so much and what led companies to borrow so much money and what could change?” Well, the first thing is that over the course of the 1980s and 1990s, there were a number of sovereign debt crises. They started in Thailand. There was contagion, it hit Russia. It hit other countries. But basically after that happened a lot of countries particularly in Asia began to accumulate big foreign exchange reserves. They essentially belonged to the national government’s bank and that money had to go and do something. Normally it would get out into the credit markets and that led to lower interest rates because the higher the supply of credit … the more interest rates go down. This is not just about the Federal Reserve here. This is about a big supply of money coming from sovereign debt funds in or basically foreign exchange reserves in sovereign debt funds in foreign countries.
Now, here’s a chart that shows foreign exchange reserves as a percentage of world GDP and you can see that that money has just grown:
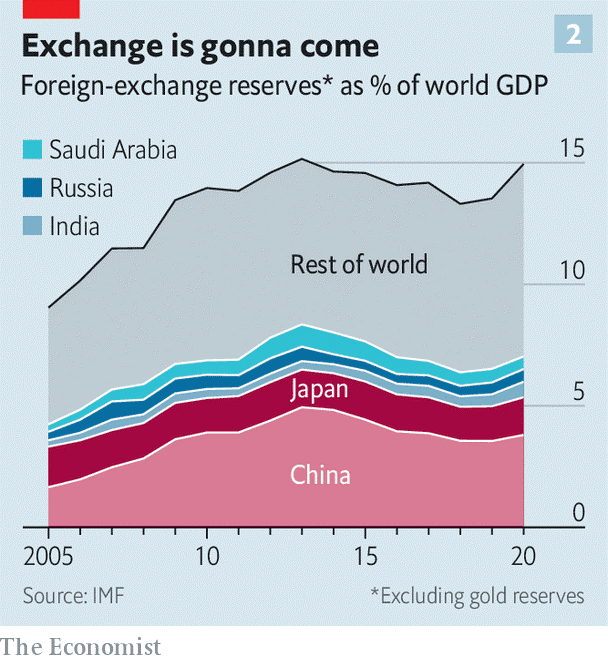
I mean the amount of money since 2005 basically as percentage of world GDP we’ve gone from, we’ve increased by 50% basically. So all those foreign exchange reserves can cycle back into credit markets very easily. That’s one of the things you got to be extremely careful of.
Now there’s another element, increased inequality. What’s interesting, I looked this up. I’m just going to look at my statistics here … from 1983 to 2019 the share of American income going to the top 10% of the population rose by 15%. The annual average saving by the top 1% of households in the United States has been bigger than average annual net domestic investment since the year 2000. That means that the top 1% of households in the United States save more every year than the entire country invests in a single year. That means that all things being equal, the supply of money goes up, and again that money has to get cycled back into something productive so it goes back into credit markets and that lowers interest rates.
We’ve had global corporate saving. Global saving by companies rose from less than 10% of GDP in 1980 to 15% in 2015. Again, that basically means that there’s more money available from the corporate sector to lend out which pushes interest rates down. In fact, the corporate sector globally has been a net lender to the global economy, not a net borrower. Think of that. We’re talking about junk bonds companies who borrow, but companies as a whole have actually put more money into credit markets than they’ve taken out. The last thing of course is the rise in the “over 50” population.
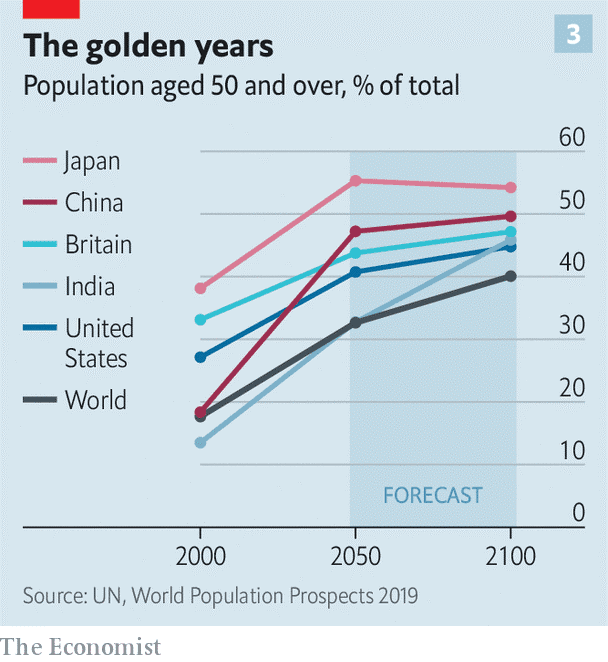
It was 15% in the 1950s, now it’s 25%. So that’s a big jump. I’m one of them. That’s expected to rise to 40% by 2100. I mean, that’s a huge jump. Now, what happens is that older people save money during their working lives so they can retire. That leads to, again, a lot of money moving into financial markets and that leads to lower interest rates. This is in fact one of the biggest elements causing low interest rates over time.
The estimates are that in the United States, aging … the increase in the number of people over 50 has actually contributed between 1% and 3% of the fallen interest rates since the 1980s. Now, why do I spell this all out? Because everybody thinks it’s about the Fed. It’s not just about the Fed. There are long-term drivers of low interest rates and this has led to the assumption that interest rates will always be low. They’ve been low since most of us can remember, certainly most younger investors won’t remember any kind of circumstances when interest rates were high. But that’s where the Fed comes in.
The Fed is the other element, the other player that can raise interest rates by raising the yield on 10-year Treasury bonds. When they raise their target interest rates, the interbank rate which in turn causes Treasury bonds to go up. The Fed doesn’t do that directly. They can also buy bonds. That’s what they’ve been doing, quantitative easing. But essentially it’s a different way for interest rates to rise. It runs counter to this long-term demographic and structural trend that I just described. But, now we have inflation. We haven’t had inflation really since the 1970s. That really is the key difference for the first time in most investors’ lifetime memory except for us old folks, inflation is now a serious concern.
Now, the problem is the higher level of inflation. If the Fed starts raising interest rates … we are predicting about a 1.75 percentage point arise in the Fed’s base rate just this year. That’s going to drive up interest rates for corporate borrowers, particularly the junk bond borrowers, those rated triple-C or lower. Now, the higher the level of debt that companies have, the bigger the squeeze they’re going to face when that actually happens. That means that the economy and the stock market has become more sensitive to high interest rates because they know that there’s been a big jump in borrowing over the last … really over the last generation. Now, the economist estimated recently that companies and households and governments pay about $10.2 trillion a year in interest. Now, that’s about 12% of global GDP. Now, if they were to raise interest rates on the trajectory that everybody expects, that would jump from 12% of global GDP to 15% of global GDP. Now, if inflation or if rates went up quicker, that could actually take us from $10.2 trillion right now to $20 trillion in interest rate payments in 2026. That would be 25% of global GDP.
Now that’s where the other thing hits companies that are indebted. If you’ve got that much money coming out of global GDP in debt repayments, that leaves less for companies or for people to spend on the products of companies. So companies are getting it coming and going, right? They’re paying more in interest on their accumulated debt. On the other hand, they’re facing a decline in consumption and this is what causes a withdrawal of liquidity in the markets because people begin to realize that if there’s real danger, that a substantial number of companies could go belly up because of credit tightening, credit conditions, rising interest rates and falling demand. Then you know that those companies’ stocks are going to decline and that starts a route. Once people start to look at it, once they start to consider this situation.
Now, this is why the situation is so important for you as an investor to think about and why looking at these junk bond spreads and yields should be part of your daily routine. Because they are the warning sign. They are what can alert you to where things are going. Now, you’re going to see headlines too, but understanding the concept of corporate debt yields and corporate debt spreads is critical to being able to look beyond the horizon and see what might be coming. Now, I’m not saying that’s going to be a problem right now, but right now in the United States corporate debt yields are only at 3.3% on average. That’s still below inflation. So these guys are essentially getting free money. If that changes, I mean you can see that changing very rapidly if the Fed starts raising interest rates, because the yields will jump.
Now, it only takes a few defaults to basically get the bond market, the corporate bond market, the buyers to say, “Uh-uh (negative) I’m not going toward junk bonds anymore.” Then they yield skyrocket because liquidity dries up in that credit market. That in turn puts pressure on the companies which puts pressure on stocks. Now, one of the big dangers at this point is over the last 10 years in particular credit standards have client dramatically. It used to be that companies had to enter into all kinds of covenants and they had to sign all kinds of side agreements agreeing to do various things to satisfy the lenders that they were prioritized paying them first. Well, that’s basically all gone away. They don’t even have covenants anymore that prevent borrowers from going to another bank and borrowing even more money, which used to be a standard part of all credit extension in the corporate sector.
So in some, we’ve gone from a situation where credit markets are priced for a world where nasty surprises don’t happen and liquidity is abundant all the time. The problem is that those assumptions are looking like they don’t hold anymore. If that’s the case, you need to be looking at corporate credit spreads and yields to know which way to go. Now, the key thing here is that this is a what-if not a definite. But it is one of the tools that you need to have in your arsenal as an investor. Pay attention to the corporate credit market, pay attention to it globally because if you face a situation of rising interest rates, rising debt service payments, and lowering consumption because of that, those rising interest rates … boom, you could have a crash. But remember we always recover from a crash. We’ve recovered from every single one that I listed earlier. So the key thing is if you get out at the right time, you get back in when things are at a bottom and starting to move back up again … that’s how you make millions.
Anyway, this is Ted Bauman signing off. I’ll talk to you again next week.
Kind regards,

Ted Bauman
Editor, The Bauman Letter