

This morning, the Bureau of Labor Statistics released the latest Consumer Price Index (CPI) numbers.
The CPI shows how much more we pay for the things we buy. In the latest report, the CPI rose 5.4% on a year-over-year basis. That means on average, we need 5.4% more money today than we did a year ago to maintain the same standard of living.
This was higher than last month’s 5.0% increase and above analysts’ expectations for a gain of 4.7%. It was also the highest reading in nearly 13 years.
Meanwhile the core CPI — which ignores volatile food and energy prices — rose 4.5% in June. That’s the sharpest move for that measure since September 1991 and well above analyst estimates of 3.8%.
In previous months, Federal Reserve officials have explained that the high inflation numbers are transitory, boosted by increases in the prices of cell phones and used vehicle costs. Of course, what we see this morning doesn’t quite agree with that.
There’s no question — inflation is running hot right now. But it’s important to understand how markets will react to this information.
The market will react based on what traders expect the Fed to do in response to the data. Based on this data, it’s likely the Fed will be forced to recognize that inflation is a risk and will take some action to mitigate it.
Traders reacted in the moments after the report was released by selling stocks. The Dow, S&P 500 and the Nasdaq 100 were all down about of a quarter of a percent, after trading close to unchanged overnight.
However, I believe this selling won’t last long. I’m confident the Fed will signal that they have a plan and stock prices will rebound.
And that’s based on more than a hunch…
History’s Winning Trade for High Inflation
Over the next few days, history tells us to expect gains in large-cap stocks.
My review of the past 20 years showed that the S&P 100 had a consistently bullish response to the July CPI announcement. To benefit from this, I recommend a trade in the iShares S&P 100 ETF (NYSE: OEF).
OEF is a relatively small exchange-traded fund (ETF), about 2% as large as the more popular SPDR S&P 500 ETF Trust (NYSE: SPY). But OEF is actually more liquid and tradable than SPY.
There are two ways to judge liquidity of an ETF. One is by measuring the difference between the bid and ask prices — otherwise known as the spread. OEF’s spread is about 0.02% on average.
A second way to judge liquidity is to evaluate the liquidity of the ETF’s largest holdings. OEF’s five largest holdings are Apple, Microsoft, Amazon.com, Facebook and Alphabet, parent company of Google. These five positions make up about 30% of the ETF’s assets. These are the most liquid equities in the stock market and their inclusion ensures there is ample liquidity in OEF.
OEF began trading in 2002. Since then, the ETF delivered a gain 13 times in the week after the July CPI release. That’s a 72.2% win rate and the third best month for this report. (September is a winning trade 74% of the time and February has an 83.3% win rate.)
On average, the gain in OEF is 0.9% in the week after a CPI release, significantly better than the average one-week gain of 0.5%.
So clearly, the odds come together for an options trade setup…
How You Could Make 76% by Friday, Betting on History
With options, we use leverage to magnify gains while limiting risk to the amount paid to enter the trade.
My recommendation for this month’s CPI trade is to buy the OEF July 16 $200 call, symbol OEF210716C00200000.
This trade should cost about $175 per contract to open with the call trading near $1.75 at writing.
If OEF closes above $201.75 on Friday, just 0.3% higher than its current level, the trade will be profitable at that entry price. If OEF is below that price, the trade will show a loss.
The maximum loss on the trade is the price paid to open the position — $1.75 per contract.
If OEF rallies 0.9% as history has shown, the index should close at just over $203 per share and the July 16 $200 calls would be worth $3 — nearly an 80% gain on the $1.75 entry price.
One more important thing about this trade…
It is important to close this trade on Friday if OEF is above $200. If you do not close it, your broker may assume you want to buy 100 shares of OEF for each call you own. They will exercise the option, place shares of OEF in your account and debit your account $20,000.
That risk is easy to avoid — just be sure to close the trade on Friday at the market price.
Remember that there is a risk of loss with any trade and you can lose 100% of your investment on any options trade. So be sure to position size appropriately, and only put in what you can afford to lose completely.
I’ll check in on this trade later this week, and let you know of any other short-term opportunities I come across.
Regards,
Michael Carr
Editor, One Trade
Chart of the Day:
Is Silver Ready to Break Out?
By Mike Merson, Managing Editor, True Options Masters
(Click here to view larger image.)
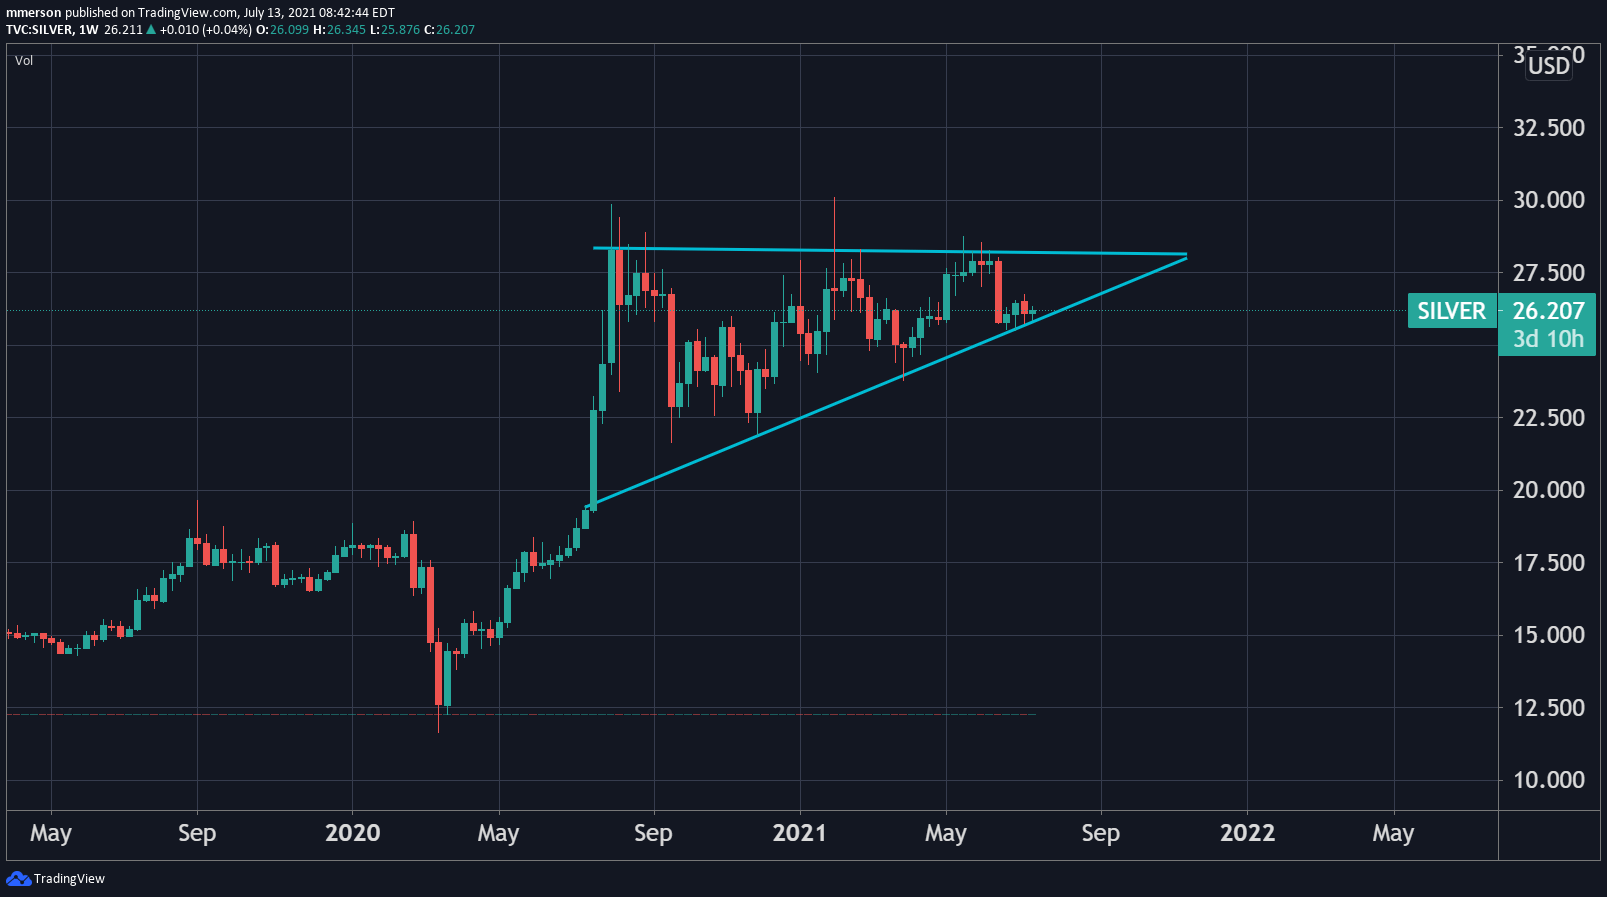
Today we’re keeping with the theme of dead-simple trading patterns, this time with a bullish ascending triangle pattern on silver prices.
Since the huge run-up in silver that started almost exactly a year ago, the metal has been trading between increasingly higher lows and a ceiling at the $28 level.
It’s bumped up against this level nine separate times, on a weekly basis.
Several of those times, silver did a “fake out” — breaking out only to quickly reverse back into the pattern, never leaving a candle above the $28 level.
I’ll be the first to admit this isn’t the cleanest ascending triangle you could ask for. The evidence is mixed. The multiple failed breakouts above the $28 level call the ceiling into question. And there are far more wick touches on each line than candles.
But there are potential catalysts to consider. As Mike mentioned, the June CPI report out today shows that inflation risk is still prevalent. If inflation continues to run hot, investors may look to precious metals as a traditional store of value. That could push silver prices up and out of this triangle.
But right now, prices threaten to break the lower trendline. If silver closes below the ascending triangle line on a weekly basis, the pattern has failed and it’ll be time to reevaluate.
Best,

Mike Merson
Managing Editor, True Options Masters


