Yes, you read that right. The VVIX indicator, not the VIX index. But before I explain…
Often the trades that seem too risky are the ones that turn out to be the most profitable.
It’s when things are at their worst. When you wonder whether another crash is inevitable and when the financial media is highlighting “Markets in Turmoil” segments. These are where the best opportunities lie.
There’s an old Wall Street saying: “Buy when there’s blood in the streets, even if that blood is your own.”
While this might be a catchy phrase, how does an investor determine whether there really is “blood in the streets?”
Are we faced with a simple skirmish or a war?
To answer that question, I turn to one of my favorite indicators to shed some light on what is really happening in the market, and what my next move should be. The VVIX indicator recently flashed a surprising buy signal, despite the market downturn.
A Sign of Panic
As investors, we are constantly barraged with endless amounts of news content, whether it’s from Washington, company earnings, the Federal Reserve or just analysts giving their forecasts. We’re all looking for a way to cut through the noise to the most important nuggets.
To cull away the useless information, I turn to one of my favorite indicators: the CBOE VIX Volatility Index (VVIX). This index tracks the “volatility of volatility,” and I think it gives you a good indication as to whether there is really “blood in the streets.”
You’ve likely heard of the VIX, or CBOE Volatility Index. Commonly referred to as the fear gauge, the VIX is used as indication of whether investors expect rough patches ahead in the market.
Specifically, the VIX is a measure of the implied volatility in short-term options on the S&P 500 Index. You can look at implied volatility as the extra premium that market makers charge for an uncertain future.
Think of an option like a home insurance contract. If you live in Florida’s Hurricane Alley, your home insurance premium is going to be higher than an inland dweller.
The options market works similarly. If you buy options on AMZN ahead of an earnings report, you will pay a higher premium for the uncertainty that the stock could move outside its expected range.
The VIX focuses on the S&P 500 over the next 30 days and tells us how much uncertainty is expected. If the VIX is low, then traders are expecting relatively calm sailing ahead and no big surprises. If the VIX is shooting higher, then traders are worried about a volatile market ahead.
Now let’s take this a step further…
How to Measure Market Volatility
The VVIX, or “volatility of volatility,” measures the rate of change in the VIX. A spike in the VVIX lets you know if there are sudden changes in the extra premium charged for an uncertain future.
From this trader’s perspective, it’s the VVIX that counts.
Sudden changes in expectations are what cause panic, (i.e., “blood in the streets”).
You can think of the VIX as “Fog Ahead” sign on the highway. Motorists see an uncertain road ahead and they adjust their behavior.
But a spike in the VVIX is like an unexpected deer running in front of you as you’re going 85 on Route 1.
You don’t have time to slow down and adjust your driving. You can only slam on the brakes or swerve off the road and hope for the best.
The VVIX is a better measure of “panic” because it shows that investors grossly misjudged the future.
And when people panic, they often act irrationally — such as swerving off the road into a canyon to avoid the deer … or selling your stocks at the bottom.
That’s why this indicator can tell us if there’s blood in the streets, because it’s a better indicator of panic. It tells us how quickly investors’ expectations are changing.
Be Ready to Buy
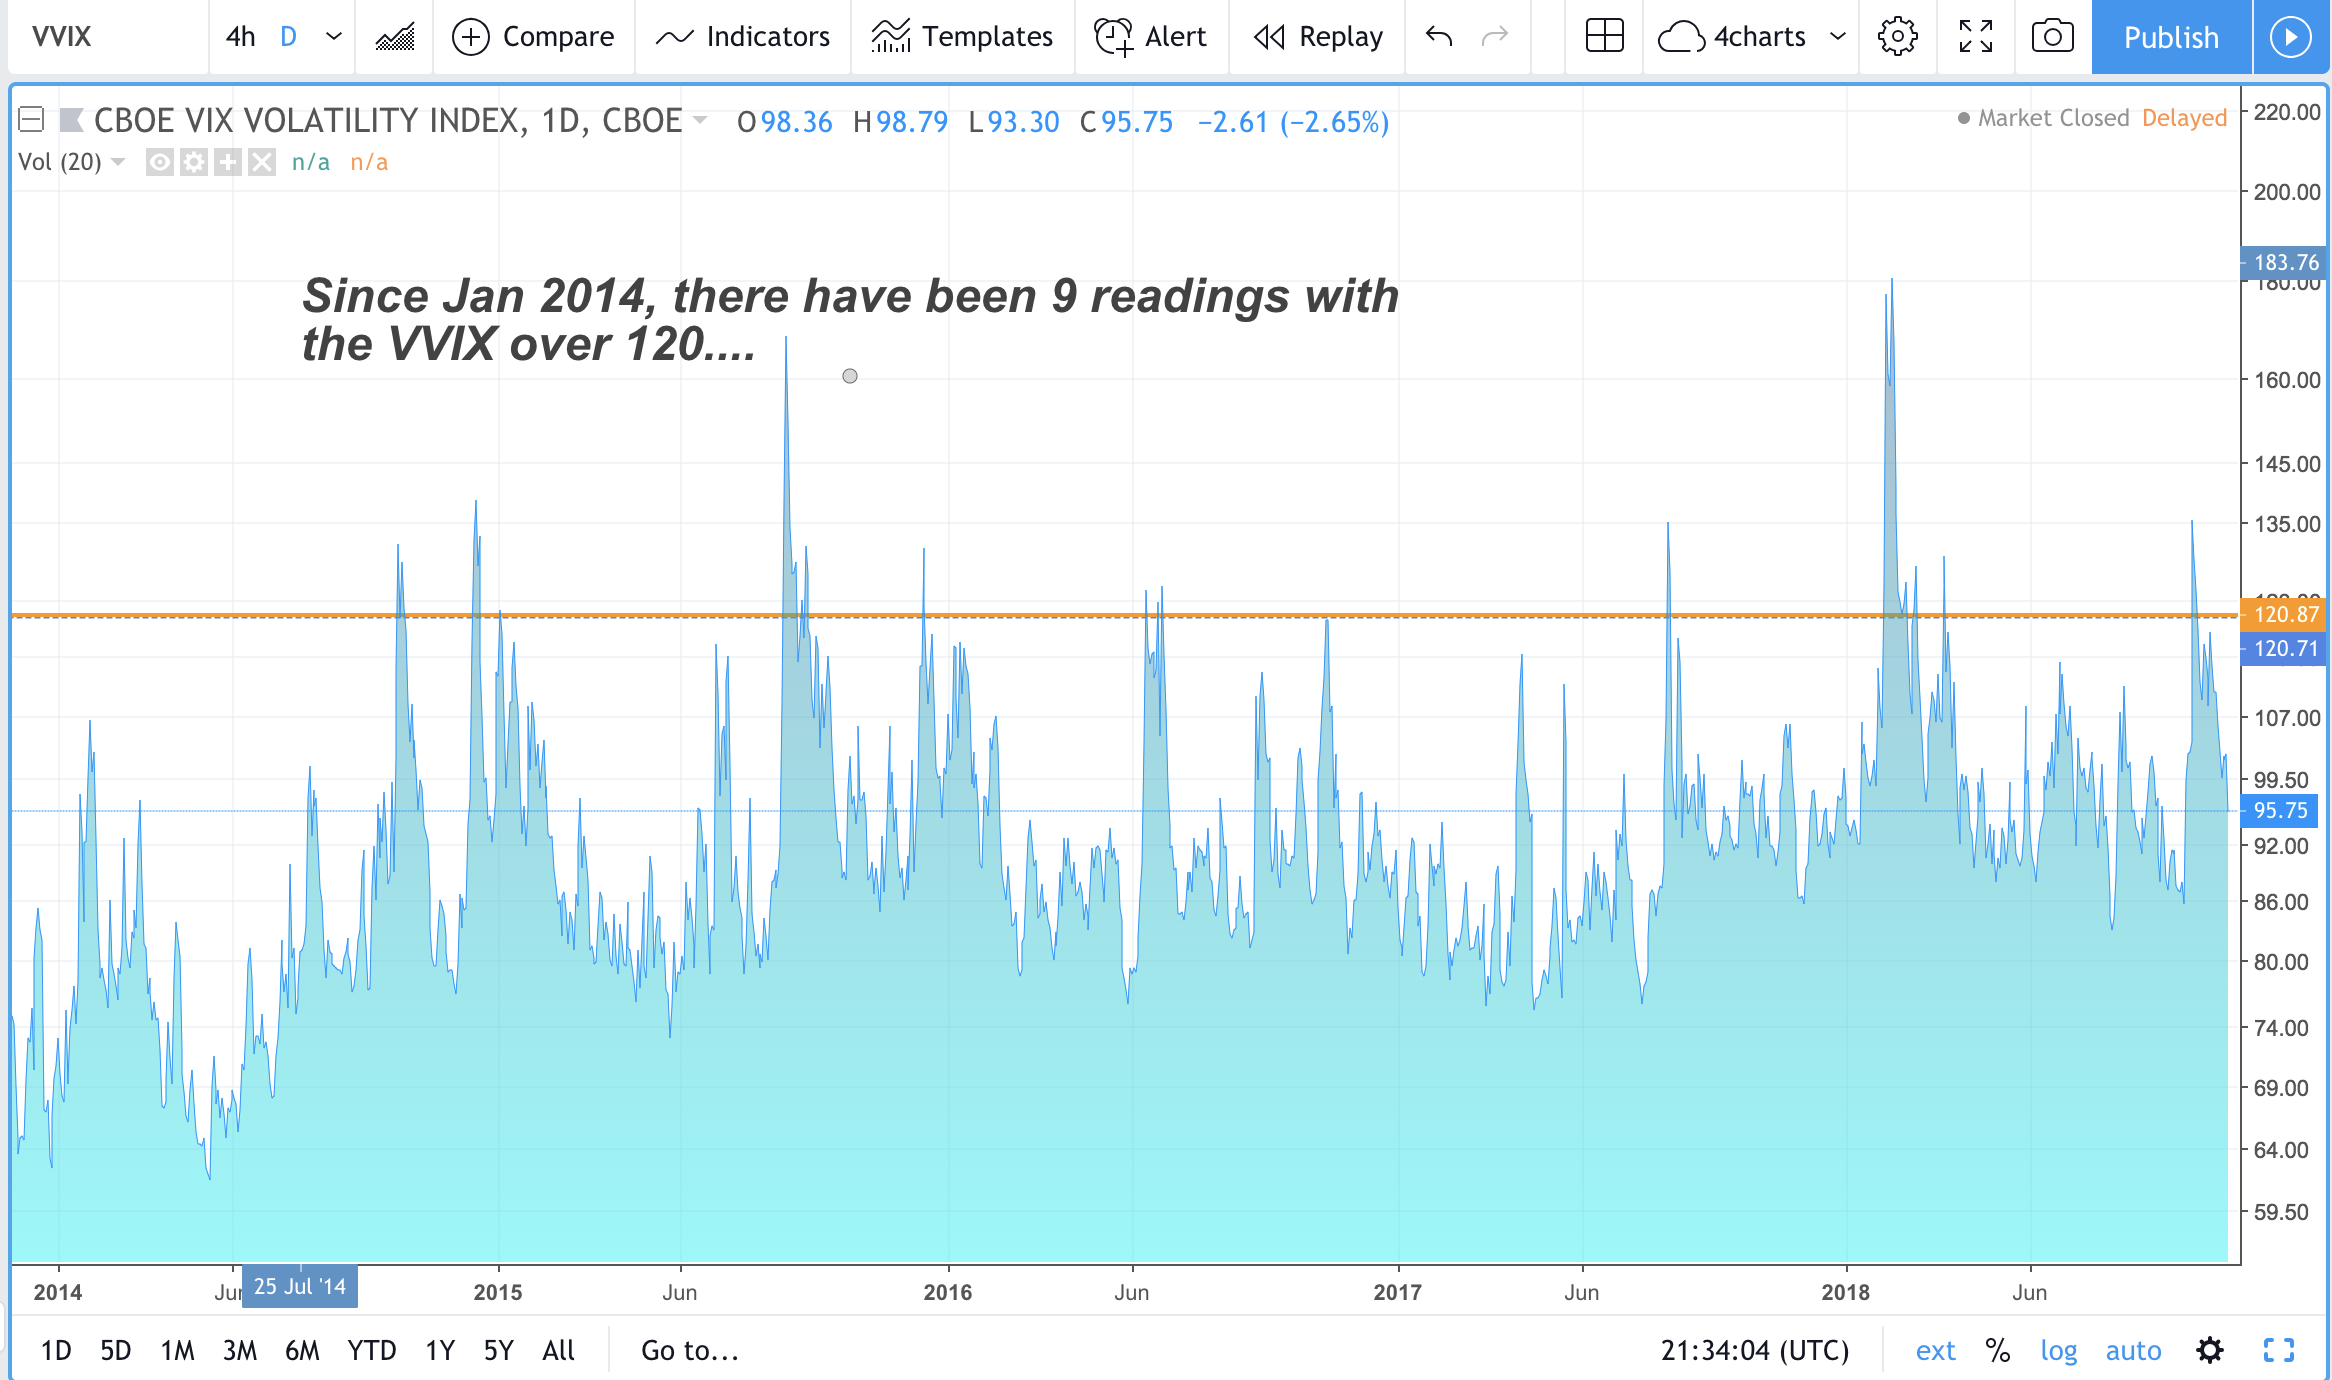
Throughout the last five years, it’s been extraordinarily accurate at forecasting bottoms. Since January 2014, there have been nine occurrences when the VVIX crossed above 120.

And in eight out of nine times the VVIX has moved over 120, the three-month return of the SPDR S&P 500 ETF (NYSE: SPY) was positive, with an average gain of 5%.
The VVIX has dipped as low as 60 and as high as 210 in August 2015 — the same day the Dow crashed 1,000 points on the open only to recover later that day.
We hit a reading above 120 on October 15. Remember how good things felt in September, and then how terrible they felt a few weeks ago?
That’s what panic feels like. There was blood in the streets, or a deer crossing the highway.
Earlier this year, the VVIX crossed 120 on March 23. SPY returned 6.75% over the next three months. It then followed that rally with another 6.6% rally over the following three months.
So when people are panicking about the market, and CNBC is running “Markets in Turmoil” segments, keep in mind that cooler heads will always prevail.
And always be on alert, because the deer runs in front of you when you least expect it.
Regards,

Ian King
Editor, Crypto Profit Trader
P.S. If you’d like to stay up to date on technologies that are set to disrupt everyday life as we know it, make sure to join my Automatic Fortunes service. I have my readers positioned to profit as trends such as 5G, self-driving cars and precision medicine skyrocket. To learn how you can join today, click here.


