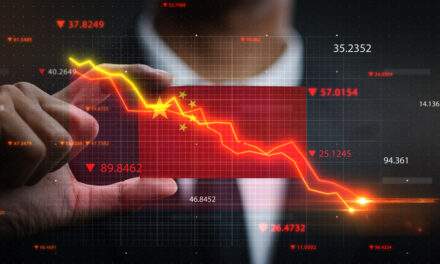
Monday’s sell-off reminded me of early 2010.
The S&P 500 had suffered its first significant pullback since the March 2009 bottom.
I had just started managing money and was surprised by the reaction of our clients. That dip created a sense of panic. People didn’t expect it — they thought the market was done falling.
Yet, I knew it was right on schedule.
Since the 1940s, the major market averages have fallen at least 5% about once a year. On average, a decline of that size occurs about once every 11 months.
In 2010, the first dip after the bear market low came after a nine-month rally. This month, the dip came after a ten-month rally.
You can’t really schedule a market decline, but if you could, those two came pretty close to being right on time.
So on Monday, I did the same thing I did when prices fell in 2010. I ignored the sense of panic. And as I always do, I followed my rules…
Keeping Traders Out of Trouble
I have always relied on rule-based systems for my trade decisions. Because rules are what keep you out of trouble when markets go awry.
They tell you when to enter, and when to exit, with no regard for anything but the parameters you’ve designed the rules around.
As a registered investment adviser, my clients expected me to follow the rules. That’s what they had signed up for.
Many had panicked in 2008 or 2009 and sold near the lows. Many others hadn’t gotten back into the market quickly and missed an opportunity to recover from their losses as stocks rallied.
As they joined our firm, I explained we were always there to talk to them. But we would not act on what they said. If they panicked and wanted to sell in a decline, they’d have to leave our firm. If they wanted to become more aggressive in a bull market, they’d have to leave our firm.
We followed rules for investing and didn’t let their emotions affect our rules.
That might sound like poor customer service. But our clients appreciated the disciplined approach we applied to their investments.
They knew no matter what happened, we would follow the rules.
Two Key Rules
Some said we were smart money managers. I always replied that I’m not that smart, but my computer is extremely smart.
My computer is so smart because it doesn’t have emotions. It does what it’s programmed to do and is incapable of deviating form the programmed rules.
The rules I programmed for managing money were relatively simple.
One key rule was to trade exchange-traded funds (ETFs) exclusively. This allowed us to focus on sectors instead of individual stocks. It also allowed us to search the world for the best investments.
This was important because there is always a bull market somewhere, as CNBC personality Jim Cramer likes to say. ETFs allow us to participate in bull markets in countries even if we don’t have access to brokers in that country.
This was also at a time where assets in ETFs were only about a half-trillion dollars. It’s now about $6 trillion, so we were ahead of the curve there.
Then I programmed rules to follow Will Rogers’ investment advice. Rogers was a popular columnist in the 1930s and often offered advice on life. When it came to investing, his advice was sound. He said, “Don’t gamble; take all your savings and buy some good stock and hold it till it goes up, then sell it. If it don’t go up, don’t buy it.”
Rogers was reaching for a laugh with that line. But he was actually describing an investment strategy known as relative strength that was first explained in a 1933 Barron’s article. It’s a mathematical way of defining how to buy stocks that go up.
After that article, relative strength went out of favor. There was an academic journal published on it in 1946 and another one in 1966. Finally, in 1993, the academic community realized that buying stocks that go up is a good idea.
It sounds obvious, but this simple idea has been the crux of investment research for decades. Since then, there have been hundreds of journal articles documenting that this idea works.
Here’s why I’m telling you all this…
Same Rules, Brand-New Strategy
I’m in the early stages of developing a new trading strategy based around my time managing money. It will keep to the same rules we established in 2010, to maintain a relatively conservative trading account while still always following the fastest-moving market at any given time.
When I say early, I mean it. We’re just starting to test this strategy internally. Once it’s been through its paces, we’ll look to release it to all of you in early 2022.
And over the next few weeks, I’ll dig into the rules that make up this new system, explain exactly how I managed money, and show you why this approach will be a winner in 2022.
Though, what may excite you most is I’ll be sharing some trades from this new strategy in these pages, starting next Friday.
Stay tuned…
Regards,

Michael Carr
Editor, One Trade
Chart of the Day:
Silver Lining

(Click here to view larger image.)
Alright, silver. I don’t know what your plan is. But you’ve successfully frustrated everyone who’s bothered to trade you for the past 12 months. Congrats.
Today’s Chart of the Day is a spiteful one, loyal reader. I’ve been holding a position in junior silver miners this year and have been absolutely whipsawed by the metal’s price action.
We’re locked in between two frustrating levels. $22, the site of the most recent silver breakout and the two major previous ones (in 1979 and 2010). And the $30 level, which has served as a cement ceiling of resistance this past year.
Every attempt at resistance has been soundly rejected. And yet, $22 has also acted as a stubborn price floor.
We’re also starting to see significant divergence in both the RSI and MACD momentum indicators. While these gauges make higher lows as the price makes lower or similar lows, that’s a good signal to get long. And that’s happening right as silver is retesting its price floor for the fifth time.
If we break that falling blue resistance line in the top right, that’s our entry signal.
It may be that precious metals only rally in times of crisis and/or central-bank money printing. But if you view the past year’s action as a consolidation period, we might be looking at the mid-term bottom for silver today.
And if silver breaches $30, look out. That’s a lot of pent-up energy ready to be spent on the upside.
Regards,

Mike Merson
Managing Editor, True Options Masters