

Following a Goldilocks jobs report that was neither too hot nor too cold, the S&P 500 ended last week with its seventh consecutive day of new record highs.
But there was something important missing: most stocks.
That’s because the S&P 500’s steady march higher was thanks to mega-cap behemoths such as Apple, Google and Amazon.
But other areas of the stock market haven’t joined the party. New highs on the New York Stock Exchange have been falling since the start of June. That means fewer stocks have been hitting new highs even as the S&P 500 has rallied.
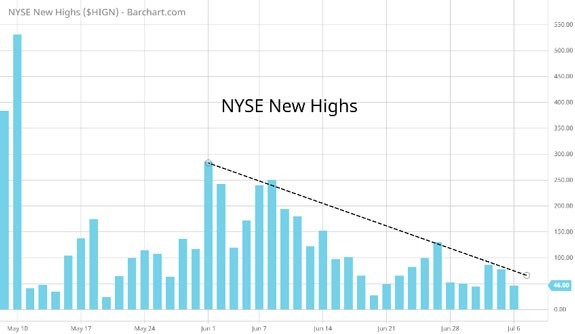
(Click here to view larger image.)
That’s exactly what you don’t want to see to prolong this bull market.
Does that mean this epic market run is on borrowed time and the FAANG (Facebook, Apple, Amazon, Netflix and Google) bubble is about to burst?
Here’s what you need to know…
Bull Markets Need This to Survive
Strong participation is the bedrock of a sustained move higher. It’s also known as market breadth and is a great tool to determine if the bull market has legs or is preparing for its final act.
Dwindling breadth is what you don’t want to see.
One popular measure is called the advance/decline (AD) line, and it was falling sharply well before the dot-com bubble burst … as shown below.
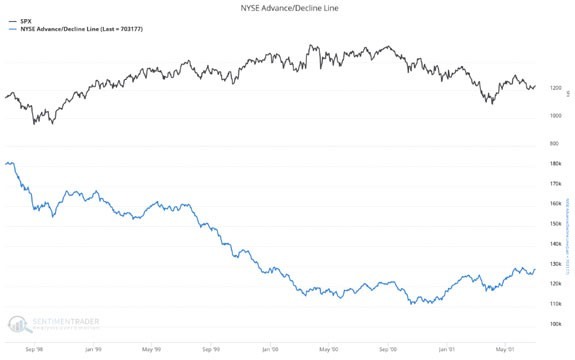
(Click here to view larger image.)
The AD line was a terrific, early warning signal back then and provided a timely prediction of the market crash during the 2008 to 2009 financial crisis as well.
So, with fewer stocks driving the stock market to new highs recently, is the AD line telling us to prepare for the bull market’s final act?
How to Prepare for the Next Move
The AD line has indeed stalled near its prior high as the S&P 500 moved higher.
But a closer look at other indexes is quite revealing … and encouraging.
The recent action in small caps explains why participation has lagged. They’ve gone nowhere as the S&P 500 has rallied.
What I’m seeing in small caps is a great sign that this market has plenty of gas left in the tank.
That’s because small-cap stocks are progressing through a basing period, which followed over 50% gains since November. It’s a sign of a healthy market when stocks consolidate gains after a big move higher — this sets up the next advance.
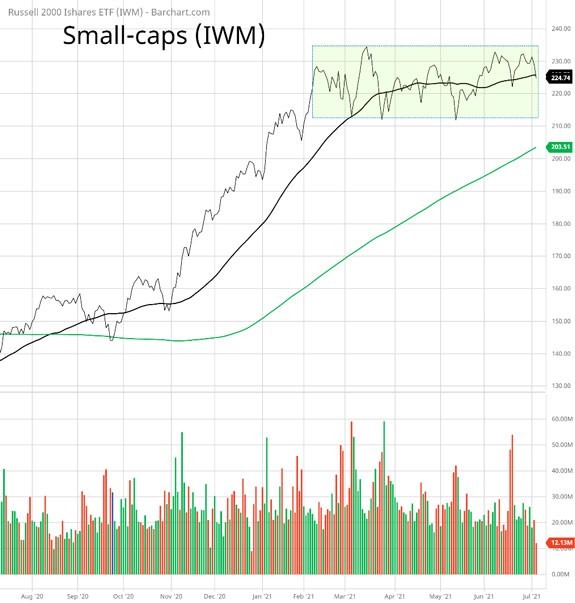
(Click here to view larger image.)
In fact, I see many signs that small caps are now oversold with Tuesday’s pullback. I expect them to turn higher, and break out of the trading range. That will drive the AD line to new highs as well.
So, pick up shares in the iShares Russell 2000 ETF (NYSE: IWM) and prepare for the bull market’s next act!
Best regards,
![]()
Clint Lee
Research Analyst, The Bauman Letter


