
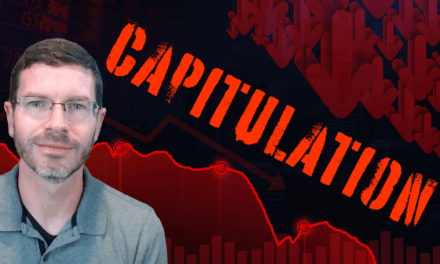
Capitulation is a signal of mass panic among investors. It’s the ultimate washout and tends to precede some of the biggest gains in stock market history.
But we just aren’t seeing it yet.
Instead, since May 20 (after two consecutive months of losses for the major indices) … we’ve seen the complete opposite. Investors are ravenously buying the dip in the latest bear market rally.
Yet, as I explain in today’s video, you should still keep your eyes out for capitulation. Because when it does come knocking, it will have a massive impact on the Fed’s next move.
Click here to watch this week’s video or click on the image below:
Transcript
Hey, everyone. Clint Lee here, research analyst for The Bauman Letter with your Big Picture, Big Profits Friday video. Now, please make sure to hit that like button, leave your comments below and subscribe to our YouTube channel if you haven’t already done so. Now, on May 20, two weeks ago, just as we completed seven consecutive down weeks on the S&P 500, the Dow saw eight straight down weeks, that was the longest stretch since 1932. So Ted and I, what we do, we hopped on the video and we outlined the reasons why you should expect a rally. And I’m happy we could call that one for you because since then the S&P 500 has jumped over 5% higher.
But here’s the thing, if you go back and watch that video, I keep calling it a bear market rally. That’s right. I don’t believe we’re done with the downside just yet. Now, you might think otherwise because of all the talk that’s out there about capitulation, but here’s the thing, I haven’t seen it yet, so that’s what I want to talk about today. I want to talk about the signs to see the ultimate bottom, the interesting link to the Fed. So what’s the Fed have to do with capitulation, or better yet, what capitulation has to do with the Fed?
So first, what is capitulation? I’m going to use that word a lot. And why does it matter? I define it as just the ultimate washout, there’s no one left to sell and it signals panic among investors, but first we need the right conditions for a capitulation to a occur. So, let’s walk through a recent example and I’ll show you that Fed relationship, that Fed link to capitulation that I just mentioned a moment ago.
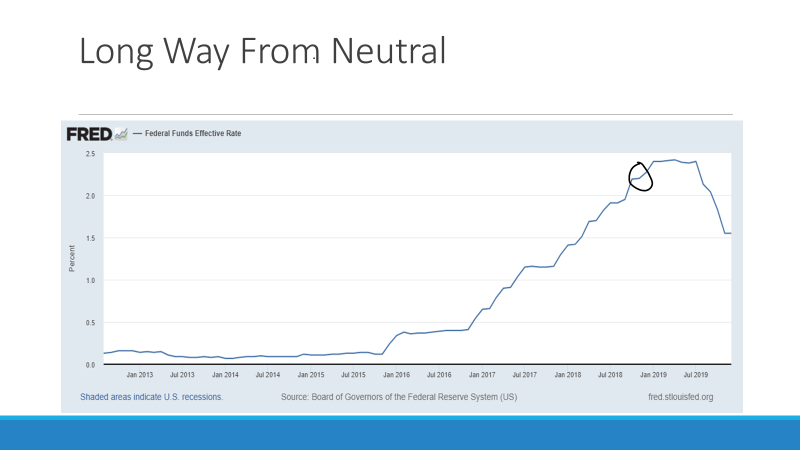
In October 2018, Fed Chairman Powell back then described interest rates as a long way from neutral, but that was nearly three years into a tightening cycle. And that absolutely spooked the hell out of investors that a more rapid rate hike was coming at a time when the economy was just starting to show some signs of losing momentum. Stocks plunged nearly 20% into late December, that wiped trillions of dollars off of household wealth. Then suddenly at the end of the year, Santa showed up:
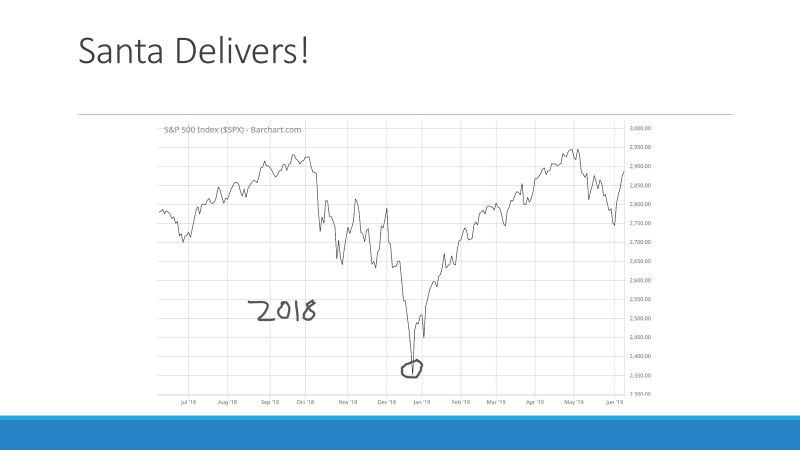
Santa showed up and gifted the stock market just an absolutely incredible rally that started exactly the day after Christmas. So, look at this chart, I mean, look at the V-bottom that we made right there.
So, what happened that led to all that?
Well, first signs of capitulation, along with a suddenly dovish Fed, admitted they made a mistake. So shortly after the stock market bottomed on January 4, 2019, which once again, as the week after the market bottomed, Powell came out and admitted the Fed had made a mistake, they went too far and he used the term patient to describe further rate hikes. Actually just seven months later, came a rate cut. Now, why do I bring this up? It’s because liquidity is the life blood of asset prices. Once again, liquidity is the life blood of asset prices. Plentiful liquidity boost prices. Taking liquidity away that can tank asset prices, stocks, crypto, housing, bored apes, NFTs … I mean, you name it.
For asset prices to stabilize, right now we need a clear signal from the Fed. We need to hear something like that soothing word “patient” from an official on guiding further action. Now, if anything, we’ve got the opposite. QT or quantitative tightening officially started this week with the balance sheet runoff. I mean, here’s what the Fed’s balance sheet reduction looks like at the planned pace:
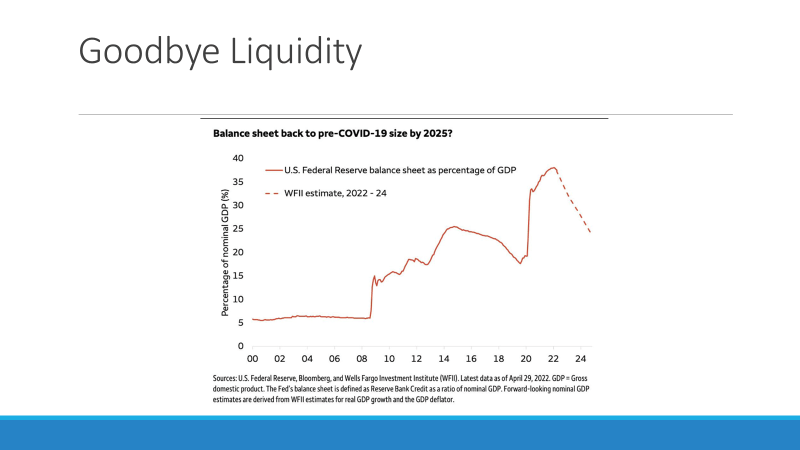
This looks at the balance sheet as a percentage GDP hitting nearly 40%, and I now expect it to fall to around 25% over the next couple years. This is what’s driving asset prices lower. It’s a double whammy of rate hikes and balance sheet shrinkage, as George Costanza call it. And there’s no change in that stance, so that’s why we have bearish conditions in stocks is because we have bearish conditions in liquidity, but that should put you on watch, put you on watch for that magic word: capitulation. Now, here’s why it matters most. That type of panic, that could be a factor that forces the Fed’s hand, just like in 2018. Look, capital markets, they’re forward looking and panic can signal some bad stuff ahead for the economy.
And we know the Fed pays attention to things like financial conditions to monitor how their policy decisions are impacting various corners of the market. So if you know how to spot capitulation, once again, you’ll know when the Fed is about to pivot. So here is what I am watching for capitulation.
First, a plunge. I want to see just an absolute plunge in Net New Highs in the stock market. That net figure, it’s simply just taking New Highs minus New Lows and a plunge in NYSE Net New Highs, that shows signs, that shows evidence of just extremely broad-based selling. That’s the sign that everyone, just absolutely everyone, has given up on stocks and has thrown in the towel. I mean, just look at the bigger selloffs in this past decade:
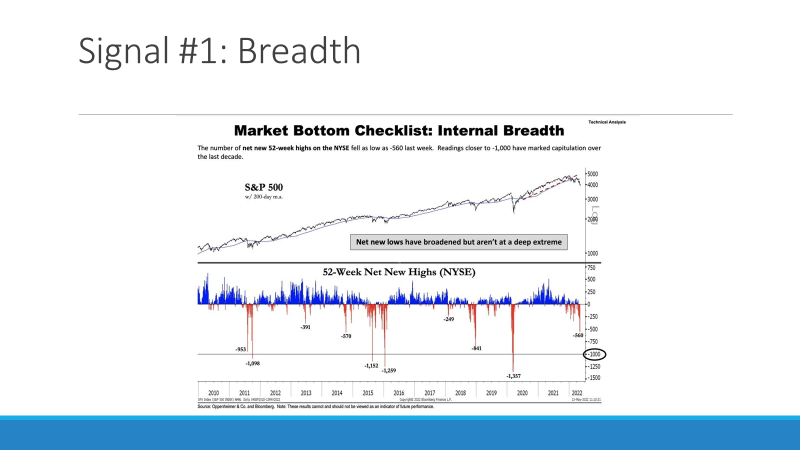
In this sell-off, we’re only about halfway to those events that showed a minus 1000 reading or more. So that makes negative 1,000, on Net New Highs on the NYSE, my capitulation level, and you can see, we still have a way to go. Next, look for a spike in high-yield spreads on junk bonds. This is just such an important signal of spreading financial distress, facing companies. Junk bond investors, they’re kind of a finicky bunch and if they sense that their money is in danger, they’re quick to push up the cost of borrowing for lower rated companies. Those are the ones that are most vulnerable to a worsening economy.
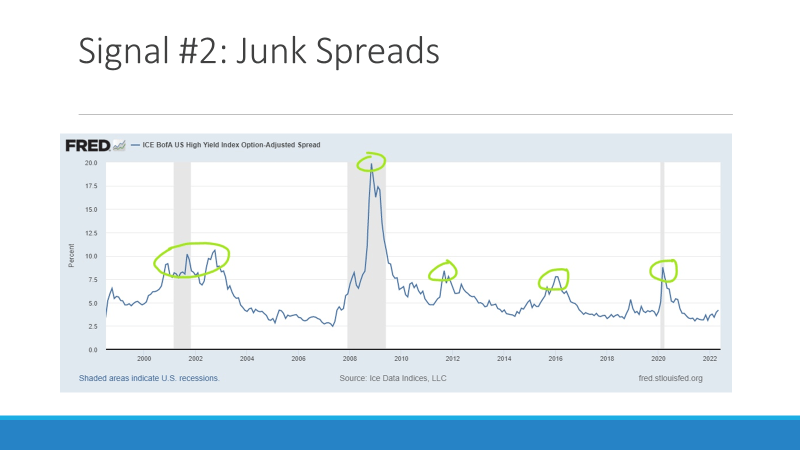
So take a look at where spreads are right now. We are just now turning higher off of what’s been some pretty low levels, historically speaking. You can see that we are nowhere near those prior spikes that I’ve got circled on here, even with the selloff in stocks this year. So I’m watching that 7.5% level, you can see that level hit back during the top dot-com bubble. We spiked well above that during the financial crisis, but then on some more of the more meaningful selloffs that we’ve seen over the past decade or so, you can see that 7.5% level coming in play again. So that’s my capitulation level for high-yield spreads is that 7.5%. That’s what I want to see on here.
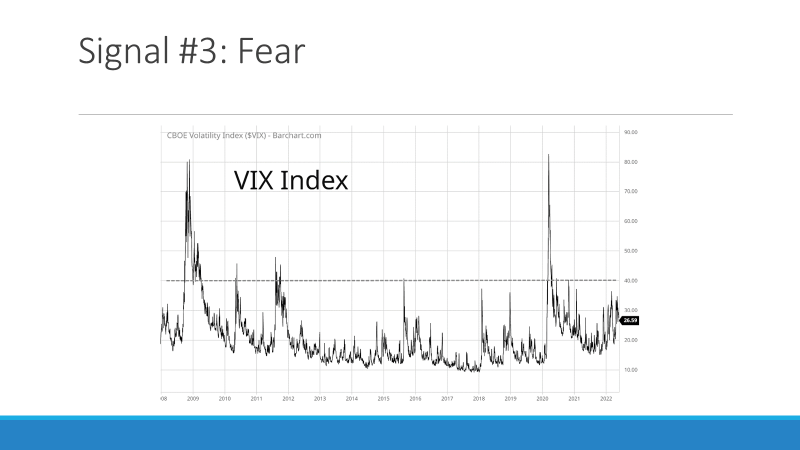
Alright, so that’s fear among the fixed-income crowd, but what about fear among stock investors? Now, look, there are many ways to measure this. You see all kinds of different sentiment surveys, asking people, “Are you feeling bullish? Are you feeling bearish?” But instead of asking how investors feel, I want to see direct evidence on how they’re voting, so to speak, with their own money. And in doing so, I’m looking at how much are people willing to pay in premiums for an option contract. And so that’s why I want to show the VIX right here. The volatility index or the VIX, is just the implied volatility for S&P 500 options.
But those rising VIX levels, which tends to happen when stocks are falling, that makes those options more expensive, which means traders are paying higher option premiums. Now, this chart goes back to the ’08 financial crisis just to put things into perspective, but you look back really since then, it’s that 40 level that’s key. That’s where I got the dash line drawn out on here, it’s once we start to see across above that 40 level has tended to mark, it’s signaling that we’re near the end of some pretty meaningful declines that we’ve seen over this period. So once again, 40 on the VIX, that’s my capitulation level.
Look, capitulation, it’s a loosely used term, one that I feel like I’ve used very excessively in this video. Maybe someone watching, can you go back and reply below with how many times I’ve said that word in this video? Anyways, what matters right here is finding a true bottom in the stock market. But you can take it further. I expect capitulation signals, the signals that I’ve been outlining here, to be closely tied to the Fed’s next move, a move that at a minimum takes away monetary policy as a headwind. Because look, they don’t have to become a tailwind to mark bottom and start to boost stock prices. We just need to Fed to not be a headwind anymore. And that’s just like in 2018; several signs of capitulation showed up just before that all important patient term was spoken.
So that’s what you should look for as we eye the second half of 2022. But that also means be prepared. Be prepared for more volatility ahead, but that doesn’t mean there’s no place to hide. Collectively, when you look at stocks that pay dividends, they are absolutely trouncing the stock market this year, which makes sense. Companies that regularly distribute income to their shareholders tend to have more stable earnings, more stable cash flows, along with healthier balance sheets. And that is what is helping them weather the storm right here. And those are the types of stocks that we target in The Bauman Letter, Endless Income portfolio.
So please sign up and have a look if you have not already done so. That’s all for me this week, please subscribe to our channel and like this video, leave your comments below. Let me know how many times I said the work capitulation and any other feedback you have. So that’s all for me this week.
Thanks for watching.
Best regards,

Clint Lee
Research Analyst, The Bauman Letter