

Investors have rediscovered stock market “fundamentals.” At least that’s how it seems from my email inbox.
I got many positive responses to last week’s article, in which I applied fundamental metrics to the Ark Innovation ETF (NYSE: ARKK). I elaborated on this in Friday’s YouTube video.
“Fundamentals” measure a company’s performance, as opposed to its stock price. The metrics we use to analyze price movements, on the other hand, are “technicals.”
The newfound interest in fundamentals is no surprise.
From its bottom in mid-March 2020 to its top in February 2021, ARKK gained 250%. In some cases, fundamentals were improving, but not enough to justify that.
In other words, it was a largely sentiment-driven bull run. People were buying the ETF because its price was going up. Because its recent price was going up, people were buying it. And so on.
But sentiment is fickle.
Since topping exactly 11 months ago today, ARKK has declined nearly 50%.
That decline reflects increasing scrutiny of the fundamentals of the companies in the ETF.
Technical momentum indicators are useful in a sentiment-driven market. Based on a stock’s recent price performance, they tell you where it might go next.
But in a fundamentals-driven market — as I expect 2022 to be — you need a different set of tools. You want to know what’s going to happen to a company’s basic performance in the future.
So, for today’s Bauman Daily, I review the key indicators my team and I use to figure out which companies to buy for that future.
Awash in a Sea of Red
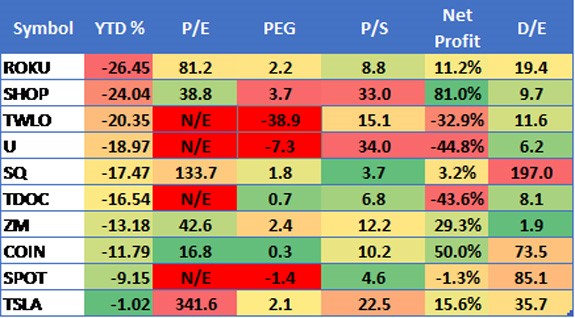
The chart below shows the year-to-date performance of the top 10 holdings in ARKK, as well as the following fundamental metrics:
- P/E — price-to-earnings ratio.
- PEG — P/E-to-earnings growth ratio.
- P/S — price-to-sales ratio.
- Net profit rate.
- D/E — debt-to-equity ratio.
(Click here to view larger image.)
- N/E = Negative Earnings.
This portfolio’s metrics are extraordinarily worse than the stock market average:
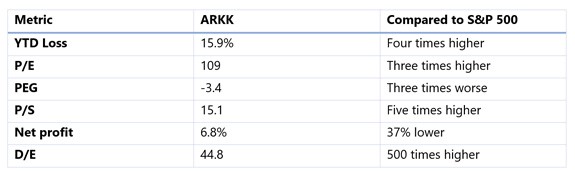
(Click here to view larger image.)
Question Is, What’s Next?
In a period of rising interest rates and uncertain growth prospects, investors paying attention to fundamental valuation metrics are likely to sell these stocks.
That’s exactly what’s happening. Every one of them except Tesla is being absolutely murdered by the market this year.
Right on time, we’re starting to see articles about the wisdom of grabbing stocks like these at a bargain price.
But which ones? That’s where fundamental metrics come in.
Let’s start with price to earnings. Four have P/E ratios absurdly higher than the market. Four have negative earnings. COIN is below the market average. SHOP and ZM are slightly above it. Whether one of those three is worth my investment dollars depends on the other metrics.
Let’s turn PEG. It divides a stock’s current P/E ratio by its trailing 12-month earnings growth rate. A reading higher than one is considered overvalued relative to earnings growth. A reading between zero and one is acceptable. Anything less than one means earnings are declining.
Of the stocks in this list, only COIN and TDOC pass muster. All the rest are either growing earnings too slowly to justify their current share price … or are experiencing declining earnings.
Now for price to sales. P/S is the number of years a company would need to generate its current annual revenue in order to justify its current share price.
But remember, revenue is the gross value of sales. What’s left after you deduct the cost of those sales, interest, taxation and depreciation are earnings. The number of years you’d need to wait for a company to generate enough earnings to compensate you for the current share price can be a lot higher than P/S.
How much longer depends on net profit. This measures how much of every dollar of revenue is profit. Obviously, the higher the better. Half the companies on this list generate net profits higher than the S&P 500 average. The other half are either still losing money or earning minuscule profits.
The final metric is debt to equity, the company’s total debt to shareholder equity. Shareholder equity is the difference between the company’s debts and its assets. It’s what would be left over if the company was wound up and all the debts paid.
Anything under zero means the company would have some value left. Anything over zero means there wouldn’t be anything left over, just debts. The higher the number, the more debt would be left. Lenders generally don’t like to give credit to companies that would have a lot of debt left over. So, they charge higher interest rates.
All companies listed in that table have more debt than shareholder equity. Some are alarming, especially SQ, SPOT, COIN, and arguably, TSLA. Tesla has historically raised capital and paid down debts by issuing more stock when its price is rising.
Maybe that’ll happen again. Who knows? Perhaps Elon Musk will tweet something about it.
Putting It All Together
Of course, all of these metrics are moving targets. They’re a mosaic, not a painting.
For example, declining earnings might reflect a company’s choice to reinvest most of its revenue in future growth. Or it might reflect excessive executive compensation.
That’s why smart investors read a company’s quarterly reports, to see how things are going under the hood.
Again, that’s not something a lot of people bothered to do in a sentiment-driven market like 2020.
Here’s how I evaluate whether a stock is worth buying when its price is falling as these are.
- Is PEG between zero and one? If it is, that means the company is growing its revenues faster than the market is rewarding it for. That’s true even if its earnings are currently negative.
- Is P/S ratio less than 10? I don’t mind waiting a while for a company to generate earnings. But exceptionally long pathways to profit are likely to be punished much more severely in a fundamentals-driven market.
- Is net profit rising or falling over time? What about the next 12 months? Here it’s important to consider a company’s business model. Shopify, Coinbase and Zoom, for example, are essentially software companies. Once you’ve written software, you don’t have to write it again, and more revenue can go to profits, which tend to rise with the user base. But other factors like PEG, P/S and D/E have a big influence here.
- D/E is tricky. The ratio depends on the value of net equity, i.e., assets less its liabilities. According to accounting rules, companies whose assets are mainly intangible must value them based on expected future earnings. Although that intellectual property might be intrinsically valuable, software companies like Shopify, Coinbase and Zoom have high D/E ratios because their “accounting” equity value is unrealistically low. But, if net profit is also high, P/S is low, and PEG is between zero and one, that might outweigh a high D/E.
In June 2020, Barstool Sports founder Dave Portnoy said “stocks only go up.”
That was true for the next nine months. Investors could get away with ignoring fundamentals.
In 2022, you can’t do that. It’s a complicated process with lots of moving parts. That’s why I publish The Bauman Letter … so you can see the fundamentals that matter in every issue!
Kind regards,

Ted Bauman
Editor, The Bauman Letter


