
Recently, I sat down with my publisher to talk about the future.
I’ve studied global macroeconomics and pattern analysis for nearly 15 years. Over that time, I’ve loved learning and sharing my knowledge with readers, helping them lead more prosperous lives.
But, I’m excited to be moving on to a new chapter in my life.
I’m stepping away from financial publishing to enter the mission field.
I will be joining the Fellowship of Christian Athletes, an international nonprofit organization focused on engaging, equipping and empowering coaches and athletes in local communities around the globe.
So, this will be my last Chart of the Week for Winning Investor Daily.
Thank you to all who followed me over the years. I appreciated your support, encouragement, questions and pursuit of smart, safe, profitable investing ideas.
I have no doubt you’re in good hands with Winning Investor Daily going forward.
I know that for those who love God all things work together for good, for those who are called according to his purpose.
One chart caught my eye this week. I’m sharing it with you today because it tells me the stock market’s recovery has come too far too fast.
My pattern analysis tells me the S&P 500 Index is set for a possible 10% correction in the next two months.
And traders should be looking for a chance to profit from the downside.
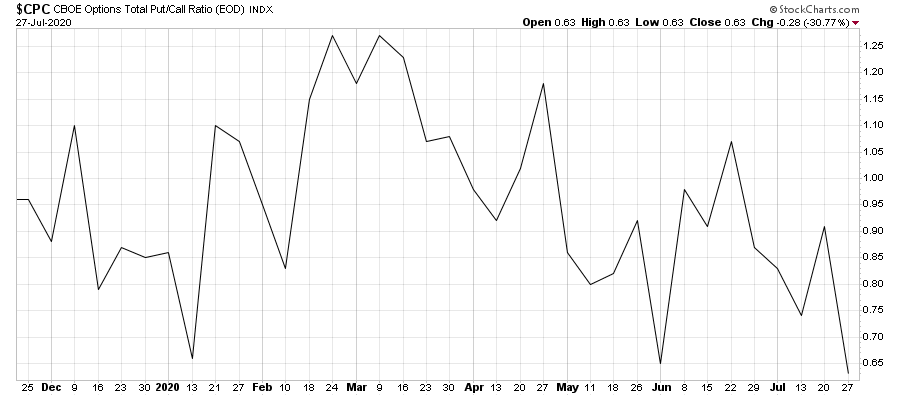
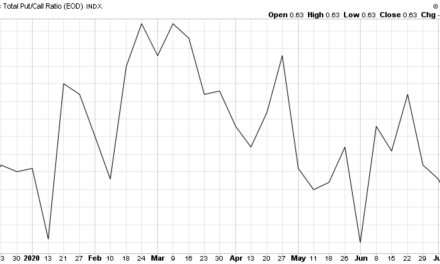
This is the Chicago Board Options Exchange (CBOE) put/call index. It shows the ratio of CBOE put option volume divided by CBOE call option volume for stocks and indices, such as the Dow Jones Industrial Average, Nasdaq Composite, Russell 2000 Index, S&P 500 Index and S&P 100 Index. I know that’s a lot of description, but basically it shows us what traders are expecting to happen in the near future.
I use this chart to pinpoint extremes in market sentiment.
That’s because put and call options are tools that allow traders to bet on a stock’s direction. Puts are bearish bets. Calls are bullish. When you break it down, it turns out it’s pretty simple.
Think of the put-to-call ratio as the bear-to-bull ratio.
I highlighted this ratio on the Nasdaq 100 Index back in January. That was just a few weeks before the market collapsed.
This time I’m focusing on more than just the tech-heavy Nasdaq stocks.
But the same trend applies: When the ratio reaches an extreme, stocks are due for a reversal.
It’s happening again right now.
The bear-to-bull ratio is at an extreme low. The bulls are dominating the bears. Everyone expects the market to go up from here.
We know what happened at the start of the year when this ratio bottomed out. The stock market cratered as scared traders reassessed their market risk.
And then again at the start of June, this ratio reached a low and the S&P 500 Index fell as much as 9% from its high to low in a matter of days.
You need not fear. Be proactive.
Protect and Profit When Stocks Fall
If you are an active trader, add hedges to protect your portfolio when the market drops. These are investments that will rise as the broader market falls.
You can target S&P 500 Index stocks with an inverse exchange-traded fund (ETF). Consider buying the ProShares UltraShort S&P 500 (NYSE: SDS).
It moves in the opposite direction — and twice as fast — as the S&P 500 Index. The index includes 500 of the largest U.S.-listed stocks.
With SDS, you make money while traders recalibrate their risk exposure and the market falls. A 10% decline in the S&P 500 Index would be about a 20% gain in SDS!
Remember, leveraged funds like this can be risky. But with the drawdown I expect in the near future, it’s worth it.
Good investing,

Editor, Apex Profit Alert