
I follow seasonal trends, and right now, oil is in a bearish seasonal trend.
Yet the commodity, as tracked by Brent crude oil, is breaking out, and that’s something to pay attention to.
Oil prices have been stuck around $50 a barrel since they collapsed in 2014. After meandering sideways for years, oil may now be finding a bottom and heading higher.
The chart below indicates that is the case, and that oil will buck its normal seasonal weakness this year. Take a look:
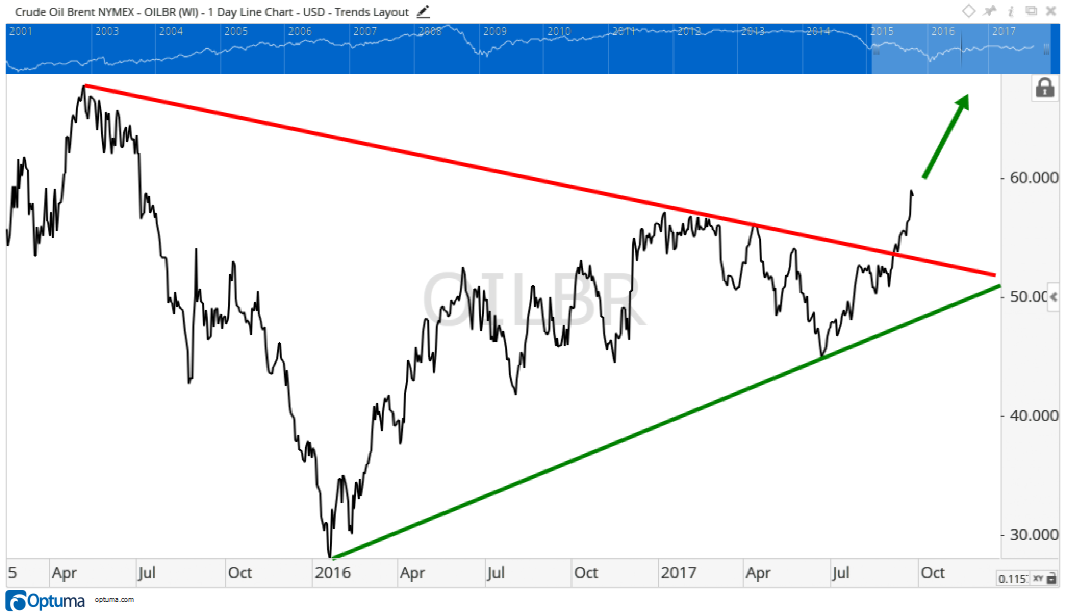
The red and green trendlines converged recently, indicating that a wedge pattern in oil prices had formed.
A wedge pattern is when prices are converging like this, failing to make new highs or lows over the time frame. In this case, the green line acted as support, while the red line was resistance. A breakout above or below either is an indication prices will continue in that direction.
Since prices broke out higher, we know about how high to expect the rally.
All you do is take the height of the wedge formation by subtracting the lower point from the higher point where each line starts. That gives us about $15. Then we add it to (in this case) or subtract it from the breakout price.
The price at which the breakout occurred was roughly $53, giving us a price target of $68 ($53 plus $15).
Brent crude oil is trading around $58 today, implying an upside for oil prices of 25%.
The ironic thing about this price target is that it puts oil prices back to where they were in May of 2015 — the first rebound after the collapse.
That point will be critical to eclipse if oil prices are going to get back to the $100-a-barrel glory days.
Regards,

Chad Shoop, CMT
Editor, Automatic Profits Alert