On Wednesday, the Federal Reserve raised short-term interest rates by a quarter point and signaled yet another quarter-point hike before the end of the year.
Notably, this is the first time the Fed funds rate — currently at 2.00% to 2.25% — has risen above the rate of inflation. The Fed’s preferred metric for inflation is the core consumer price index, which excludes food and energy. The most recent reading came in at 2% in July.
But sometimes, it’s not what the Fed says that matters. It’s what the Fed doesn’t say.
For the first time in almost a decade, the Fed dropped language saying: “The stance of monetary policy remains accommodative.”
This move is part of a normalization process, as the Fed unwinds the grandest monetary experiment of all time. This eight-year experiment saw zero-percent interest rates and a $4 trillion expansion of the monetary base.
And the real test begins as we learn whether the economy is strong enough to finally stand on its own…
Finding the Right Balance
I’ve often thought of the Fed as a parent teaching her child how to ride a bike, holding the bottom of the seat even with the training wheels still on.
One at a time, the training wheels carefully come off. The first training wheel was quantitative easing, and the market held steady.
The next training wheel was lifting interest rates off 0%, and the market still refused to topple.
Right now, as the Fed lifts interest rates above the inflation rate and removes the “accommodative” language, the parent’s guiding hand under the seat is coming off.
That implies there’s a high degree of uncertainty as to whether the child can ride off down the street or will crash into the neighbor’s hedges.
The good news is that the kid on the bike has some forward momentum.
Trump’s tax cuts and deregulation have resulted in an economy that’s growing at the fastest pace in several years.
Business and consumer confidences are running at multi-decade highs.
Earnings from companies within the S&P 500 Index are expected to rise by 15% this year.
And the number of employers looking to hire exceeds the number of people looking for jobs.
The economy is looking very solid right now.
But every parent knows there is a delicate balance between giving the child a nice, stable push and an aggressive shove. A gentle push gets them on the way to a successful ride. A shove might get them farther initially, but the added velocity means that it’s easier to lose control.
The Only Curve That Matters Right Now
As short-term interest rates head into territory not seen since 2008, investors will be focused on the yield curve for signs of financial stress.
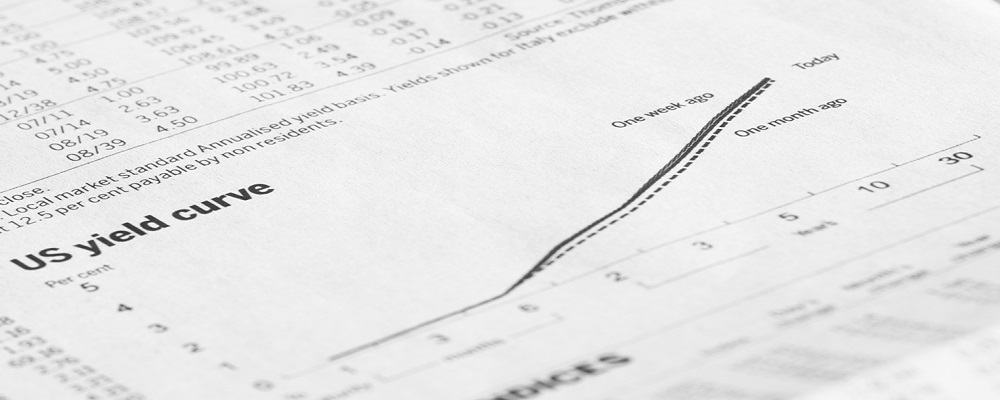
To understand the logic of the yield curve, we must look at what it represents. The yield curve is a picture of how investors believe the economy will fare in the future.
If investors believe the economy will be strong, the yield curve will steepen. This means that short-term interest rates are much lower than long-term rates. This is a sign that the economy is picking up and inflation expectations are rising.
On the other hand, if investors are worried about future growth expectations, the yield curve will flatten or invert. An inverted yield curve where short-term rates higher than long-term rates is a strong predictor of economic recession.
That’s because banks borrow on the short end of the curve and lend on the long end. Lending profits are roughly determined by the difference between the short and long rates.
This becomes a self-fulfilling prophecy. If lending activity is more profitable, credit expands and drives growth. When lending slows, so does economic growth.
When the 2008 recession hit, the Fed started priming the pump by lowering rates to get the economy moving again.
Now that the Fed is pulling back on stimulus, investors worry whether the Fed has done enough. This causes the curve to flatten.
What’s important for us is how the yield curve changes over time.
Here’s a chart of two yield curves: one drawn yesterday (green) and the other from six months ago (blue).
What’s notable is that the Fed has raised rates in the short-term (on the left side of the graph) and this has resulted in a flattening of the curve between the 2-year and 10-year notes.
The Bottom Line
The flattening yield curve suggests that bond traders are wary of the Fed rate increases and its less accommodative stance. Stocks have not yet reacted to the flattening yield curve.
The next major market move will arrive in the form of higher long-term interest rates or lower stock prices.
Let’s hope that kid watches out for the neighbor’s bushes.
Regards,
Ian King
Editor, Crypto Profit Trader
