


Some people make stocks complicated.
But we don’t need to.
At the end of the day, any stock can only do three things. It can go up. It can go down. Or it can go sideways.
Most traders only focus on the first two. We all love it when our stocks go up, but we get frustrated when they go down.
But a sideways stock is a totally different animal. And if you are buying and holding stocks, it can be frustrating to have one that isn’t budging. At first glance, it seems impossible to make a profit on a situation like that.
The good news is that there are ways to capitalize on these sideways stocks.
I’m talking about selling put options.
In September, I explained how I sell put options to win on more than 90% of my trades.
A 90% win rate is impressive, and I’ve used it to create a consistent string of gains. As I told you in that issue, these gains are so consistent that some traders simply use them as income.
In that article, I explained the No. 1 rule for selling put options: Make sure you want to own the stock.
Since owning shares of the underlying stock would be the worst-case scenario, that’s the first thing you want to be certain about before selling a put option.
Today, I want to share the secret that makes it all possible.
Stacking the Odds
When you sell a put option, you are getting paid to possibly buy a stock at a certain price on or before a certain date.
That payment — the option premium — is the same whether the stock roars higher or stays perfectly flat. We are still getting paid.
But what about a stock that drops?
We could still see gains before we would ever be forced to buy the stock.
This is the secret to success with selling options for income.
If a stock can only do three things, we are stacking the odds in our favor by generating the same amount of profit even if a stock does any of the three.
In my Pure Income options service, this is all we do — sell put options for consistent gains.
And a recommendation I made last Wednesday was the perfect example.
In fairness to my Pure Income subscribers, I can’t tell you what this stock was. But I can show you a few details about why it was such a great trade…
It was on a stock that is exploring a new industry with incredible growth potential. After a quick dip in shares, we swooped in to collect income from this company.
We were getting paid 10% in just four months to sell the put option. The price we wanted to own the stock was $18 per share. The premium we collected for selling the option was $1.95 per share. That’s a payment of 10.8% for simply saying we want to buy shares of the stock at that strike price. Annualized, this would be 30% in income for the year.
If the stock goes up or stays flat, we still collect the same 10% in income.
But what was interesting with this one is that shares could fall by nearly a third of their value, and would still would collect the same 10% in income as if the stock shot higher or stayed flat.
So, shares could go up, sideways or down nearly 30%, and we would walk away with the exact same result.
If it falls more than that, only then would we be at risk of losing profits and owning shares at our strike price. But the income is still ours to keep.
Then, we simply would own shares of a great company. And as I said in September, we only make these trades on stocks we want to own. So, either we get quick income and a return on the trade, or we own a stock we wanted to own anyway. This process becomes a no-brainer, win-win scenario.
And when we stack the odds in our favor, we are able to generate a consistent stream of gains.
This strategy is by far one of the best approaches when it comes to options income. But the doors to this service have been closed for six months now.
Today, I’m excited to let you know that we’re finally allowing new members to benefit from my No. 1 income approach.
Even better, we’re offering it as part of a bundle — Pure Income, Quick Hit Profits and another newsletter I write that focuses on hidden patterns in the market. You can get access to all of these services with the push of one button.
And as an added bonus, you’ll also be getting access to some brand-new research that I’ve been working on with my colleague Charles Mizrahi, who has been ranked Barron’s No. 1 trader. He has a wealth of experience, and I’m excited for you to see what we have coming.
You can click here to see all the benefits, plus get your early access.
Update on Qualcomm
We still have an open option recommendation on Qualcomm (Nasdaq: QCOM). I wanted to let you know I’m keeping a close eye on it. After an early rally, the option has lost some steam. We still have time for the returns to improve. When it’s time to exit, I’ll send you an alert to take action.
Bank It or Tank It: Automatic Data Processing Stock
Before I sign off, I wanted to let you know about my latest Bank It or Tank It video on YouTube.
I just posted this new video yesterday morning on a stock well–known for its payroll processing services for many companies, big and small — Automatic Data Processing. I go over everything you need to know, including its most recent expansion in human resources, from its fundamentals and sentiment, to what the price chart is telling us to expect over the next 12 months.
You can watch my new video here:

Bank It or Tank It: Automatic Data Processing Inc.
Summary:
- Automatic Data Processing is known to do payroll for small and large clients.
- It’s expanded into another area over recent years.
- Take a look at the fundamentals, sentiment and technicals to find out if you should “Bank” or “Tank” ADP.
In my latest edition of Bank It or Tank It today, we’re going to be covering a stock that’s trying to end 2020 on a high note — Automatic Data Processing Inc. (ADP). It’s known to do payroll for small and large clients. And the company helps organize everything on the payroll side for a smooth, seamless process.
It’s been expanding over the last several years, into human resources (HR) and helping companies outsource that.
We’re going to take a look today to see if that’s helping keep the company relevant in uncertain times like we’ve been through, here in 2020.
So, let’s jump right in…
ADP — The Fundamentals
We’re going to get started with the fundamentals of Automatic Data Processing (ADP), and we’re going to do that with the key stats…
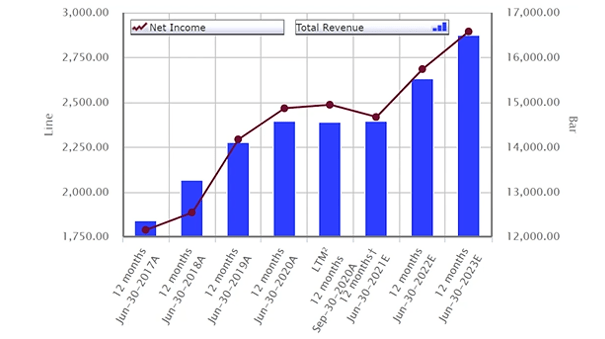

Source: S&P Capital IQ
The two key stats that we always like to take a look at are net income (the line on the chart, on the left-hand side); and total revenue, (the blue bars, on the right-hand side).
Now, we see a nice rise for net income over the years, starting in 2017 through 2020 , and a nice rise in total revenue. So, everything’s looking good.
And you can see a bit of a slump from 2020 to 2021, where it flatlines.
All of that is due to the coronavirus pandemic. ADP has had a slowdown in orders and companies interested in growing and using its payroll services.
When you think about all the layoffs and issues that we’ve had here in 2020, it’s really been a hit to the smaller corporations in our economy. That’s primarily who Automatic Data Processing likes to pitch its products to and who its target market is. So, for those on a hiring slowdown, a payroll company like Automatic Data Processing tends to see a slowdown along with them.
But once we get out of that in 2022 and 2023, the expectations are for revenue and net income to continue the same trajectory that they’ve been on, with a nice steady climb. Those are some expectations that are baked in on returning to normal, assuming there’s no other disruptions to the Automatic Data Processing client market that’s going to impact its business over the next several years.
Let’s pull up some quick comps of Automatic Data Processing and its key competitors to see how this company stacks up…
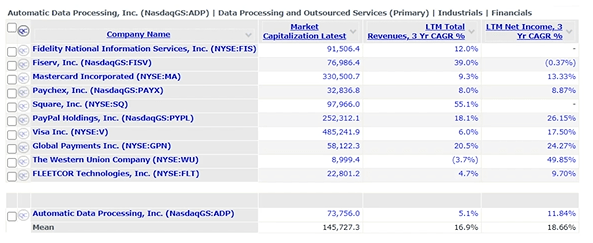

Source: S&P Capital IQ
The market cap (basically just the size of the company) for Automatic Data Processing is $73 billion. The average of the competitors is $145 billion. And just three stocks are massive companies: Visa (NYSE: V), which is more of a credit card company, but it’s been expanding; PayPal (Nasdaq: PYPL), which is an online payments company; and Mastercard (NYSE: MA). So these are the $485 billion, $250 billion, $300 billion companies that Automatic Data Processing is up against.
But the sleeper in here is Square (NYSE: SQ), that’s really just been skyrocketing in growth.
Next, we look to revenues. Fifty-five percent growth for Square, a $97 billion company. Automatic Data Processing is a $73 billion company but only saw 5% revenue growth. So it’s a smaller company, but it’s not seeing revenue growth anywhere near the average of its competitors.
The mean for revenue growth is 16.9%. And again, Square’s pushing that on the high side. But we also have Fiserv (FISV), PayPal, Global Payments (GPN), and even Fidelity National Information Services (FIS) that are pushing the limits on the higher end of the growth rate. And they’re all beating out Automatic Data Processing.
Now, on the net income side, ADP is still lagging behind its competitors: 11.84% growth rate. And, 18.66% is the average for its quick comps.
The one really holding this up is Western Union (WU), which has really been struggling lately. It’s an international payments company, but it’s been disrupted a lot by PayPal, Square, and these other companies.
You can see Western Union’s revenues is negative, actually. It’s done a good job of increasing net income, but it’s all it has to focus on after revenues are sliding.
But even the other companies — Global Payments, Visa, PayPal, MasterCard — are all above ADP in net income growth. Square has a negative three-year compound average annual growth rate (CAGR) for net income. So, we can’t understand how that’s looking.
But when we step back and we look at ADP on this level, it’s a smaller company based on the market cap, but it’s not growing revenues keeping up with its peers. And the net income is not growing at a competitive rate, either.
Here’s one more chart before we dive into the sentiment readings…

Source: S&P Capital IQ
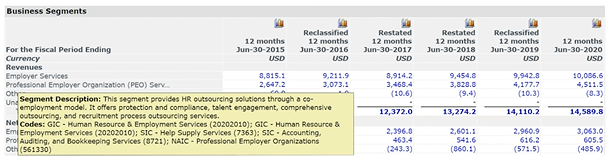
This chart breaks down the segments here of ADP and between its employer services, which is basically the payroll division. This is its traditional business model: setting up payroll and helping outsource all of that.
ADP’s relatively new segment that’s been growing rapidly is its Professional Employer Organization (PEO) services. This is its HR department, where it’s outsourcing HR solutions through itself. And you can see on the chart back in 2015, it was just $2.6 billion.
Today, in 2020, we’re at $4.5 billion. So, that’s seen a pretty monumental growth compared to its payroll division, which was $8.8 billion in 2015 and only went up to $10 billion in 2020. So, that’s a very small movement there in ADP’s growth rate.
But you can see the growth that ADP’s really been going through over the last five years has been coming from this HR department. I point that out because it’s almost in contrast to the route that Square’s taking.
Square is a payment provider for small businesses. It lets you take payments via iPads or even via mobile funds. And it helps set that up with your customers to where it’s a very seamless transaction, where you can accept credit cards and even cash right on the spot.
What it’s been doing now is moving over to payroll. So, it’s hooking all these small businesses with this software platform to take payments that’s extremely beneficial to companies just getting started (low costs). And then, it’s been pushing into payroll.
So, Square is coming in at the ground level. Then, it’s taking payroll. That’s dipping into ADP’s territory, where the payroll division has been its target market.
But now, Square’s coming in from the bottom, where it has this seamless entry it can come in on, compete on payments, and then extend that relationship and those cost benefits into the payroll department.
The solution from ADP has been to go the other way, for companies that are large enough that need human resources, to be able to outsource some of those handlings of the human resource department. ADP is now combining that with its payroll department.
So, that’s how ADP’s seeing some cost beneficiaries. At some point, maybe these companies could even merge. But right now, you have to be a little concerned, if you’re a shareholder of ADP, that Square’s starting to take chunks out of the bread and butter that would’ve been ADP’s clientele. That’s going to be something that we want to continue to keep an eye on, because it’s relatively new for Square.
Like I said, Square started as this payment company and revolutionized how these small corporations can take payments. And now, it’s pushed that into the payroll side.
On the other hand, ADP has just been all payroll. Now, it’s moving into the human resources side to try to compete with that.
That’s why we wanted to take a look at what’s growing here. So, the human resource department is really fueling the growth. It’s grown up almost $2 billion just in that HR department over the last five or six years. And ADP’s employer services, which is three to four times larger than its HR department, has grown by the same $2 billion.
That just gives you the type of impact that ADP’s HR department is having on its revenue growth. And it’s really helping drive this company forward into the future.
The question is, what are its small business partners going to need more down the line? Are they going to rely more on outsourcing the HR department, or are they going to need the payment and smooth transition from the payments right into their payroll with Square?
So, ADP and Square are going to be the two big giants to watch as these companies dig into this competition even more in the coming years.
Investor Sentiment
Now, for the sentiment reading…
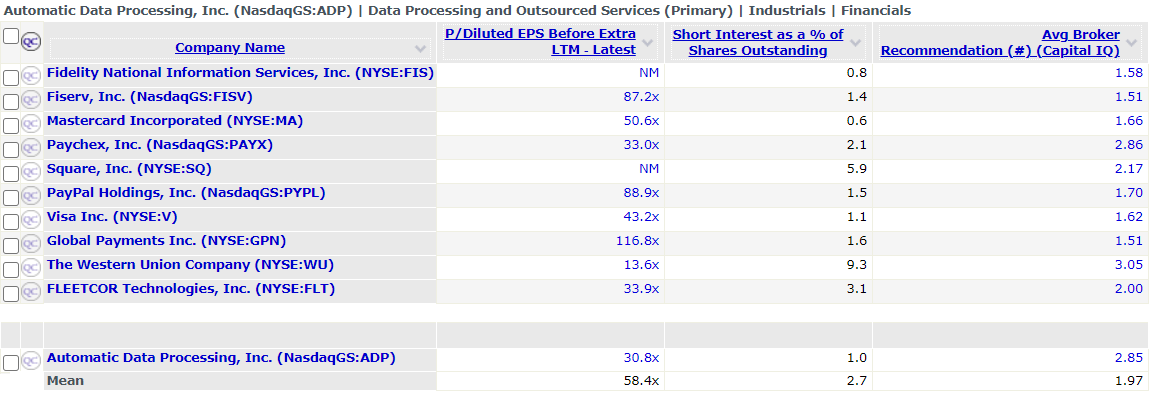

Source: S&P Capital IQ
We’re looking at price-to-earnings, short interest and the average broker recommendation. All three are basically the investor sentiment on the company. Investor sentiment gives us an idea of how investors feel and what they’re thinking about the company.
Price-to-earnings is what investors are willing to pay per dollar of earnings for the share price of the stock. For ADP, it’s 30 times earnings. Compared to the broad stock market, that’s pretty high.
But when we look at the average of these payment stocks, it’s actually nowhere near the average of 56 times earnings. When you look at Fiserv, 87 times earnings; PayPal, 88 times earnings; Visa, 43 times earnings; Global Payments, 116 times earnings.
Square doesn’t have positive earnings. But you can imagine that people are willing to pay up for Square, when you see the type of revenue growth that it’s going through. It’s at breakneck speeds. So, you know that Square’s going to have a high price-to-earnings ratio, as well.
This tells us that investors are not really willing to pay up too much for ADP. Yes, 30 times earnings is still high, but not compared to some of its competitors. So, that’s really how you want to view the price-to-earnings ratios. What is the industry getting that the company competes in? And it’s lagging behind that.
ADP is not drawing as much investor interest. But when we look at short interest, this is as a percent of shares outstanding. The higher the number, the more investors in the stock are willing to bet that the stock is going lower.
For ADP, it’s only 1%. So, that’s really great to see, and there aren’t a lot of people who are concerned this stock is about to fall off a cliff.
When you look at Western Union, it’s at 9.3%. That’s a stock that a lot of investors are saying, “Whoa. Let’s back up. This stock is about to tank.”
Even Square, at 5.9%. That’s because this is a volatile stock. It’s shot up. It’s a very hype-driven stock. And when investors see stocks like that, where they can just swing on an earnings beat or an earnings miss because it’s relatively young, you tend to see higher short-interest ratios, as well.
But that just gives you a heads-up that Square is a volatile stock. ADP’s 1% short-interest ratio, gives it some stability. Not a lot of people are betting on the stock to go lower.
The average broker recommendation just tells us whether or not they have it as a buy, which would be a 1, or a sell, which would be a 5. So 1 to 5 is our scale.
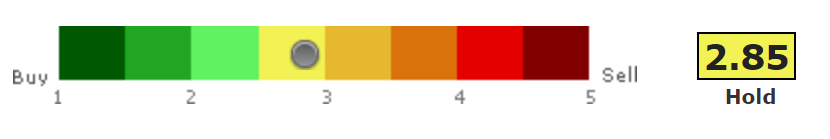

Source: S&P Capital IQ
ADP is sitting at 2.85. That’s basically a 3, right in the middle. So, it would be a “hold.”
The average for the industry is 1.98. So, it’s a slight “buy” for the industry.
So, here we are, again. When we looked at the revenue, the net income growth, and the market cap, ADP was kind of small for the industry and a little behind in revenue and earnings growth. And now, it’s behind in getting a price-to-earnings ratio, and it’s behind in the average broker recommendation.
Everything is telling us that, yes, ADP is a solid company, but it’s not the winner in the payment space right now.
Now, that doesn’t necessarily have to be a bad thing, but it tells us that our investors are a little concerned about the stock, where it sits and its human resources approach to competing with the other companies coming in from the ground up, like Square.
So, it’s just a matter of which way is going to have the best growth going forward in taking over this industry.
A Look at the Technicals
Now, let’s take a look at the company’s technicals to figure out whether or not this is a stock that we’re going to bank or tank in 2021. Here’s our price chart for ADP…
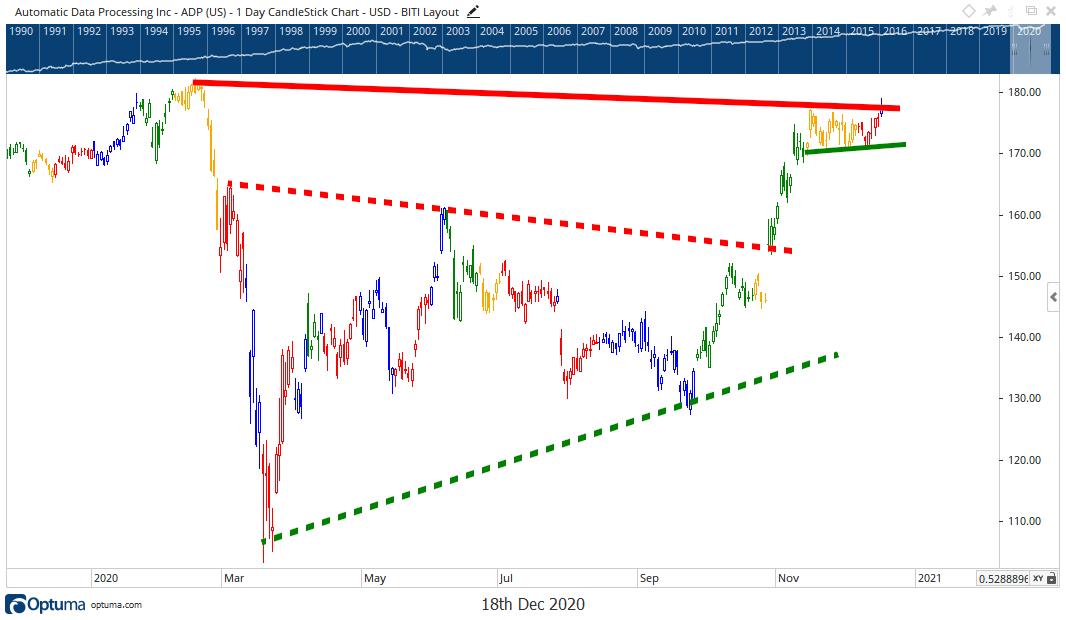

Source: Optuma.com
The top solid red line is up at $176 a share. Then, we have the bottom rising support, the green dotted line, that’s way down at $135 a share.
So, this is a huge gap, and I hate drawing them, because it basically says: What are you going to do until it breaks above this? There’s a big risk that it can fall back down to $140 a share. The thing is, it’s still in an uptrend, and it’s still a stock that you wouldn’t want to hold.
So, if you’re buying on the way down, that’s okay. But if you’re a holder today, what do you do?
I drew in the shorter-term trend lines, and the dotted red line across the middle just gives you an idea that it created a wedge pattern after the 2020 pandemic crisis that we had (the two dotted lines). And then it bounced around and, eventually, it broke out and it got to rally up. Now, it started to consolidate again.
Notice that it’s been red over the past several days, which means that it’s lagging based on the Relative Rotation Graph. I started using this to shade the chart, because I have found the Relative Rotation Graph is extremely helpful.
Basically, it compares ADP to the overall stock market, the S&P 500 Index.
It’s telling us if it’s green, it’s leading the market; when it’s yellow, it’s weakening; when it’s red, it’s lagging the market; and when it turns blue, then it starts to improve. Then it goes into the leading quadrant again.
Stocks go through this natural rotation, where they don’t lead the market for extended periods of time. They don’t lag the market for extended periods of time, either. So, we can use that rotation to understand that, once it weakens, and then, lags, the next step is that it should start to improve. That gives us an indication that we could see the breakout of the little trend channel over the next couple of weeks. That’s what you want to watch.
For short-term traders, you want to watch the little green support line and the red resistance line (at the top). It’s not going to give you a major price target on a breakout, because it’s such a small consolidation, but it would be great to see the continuation of the uptrend out of that. Because, when we zoomed out and we could see that we had the two resistance lines, we had a major resistance line up top.
It’s going to be a lower high on the chart, and that’s the start of what could be a downtrend.
We don’t want to see a downtrend for the stock, because, even though ADP has some uncertainties around the whole competition with Square and going the human resources route, this is a company that I’m going to put on my Bank It list. Because it is a pennant stock.
Banking on ADP
As the economy turns around in 2021, as the vaccines rollout, and the economies open up again, payroll companies like ADP are going to continue to climb.
Now, is this the best payroll company or payment stock that you could be in? Probably not. But it’s still a stock that’s on my Bank It list.
Maybe the whole industry is a Bank It industry, and that’s kind of helping my consensus behind this company. But overall, this is a stock that I want to bank on going higher in 2021.
2020 has been a year to forget for the stock. Add the major crash. It’s not even back up to new highs like many stocks are right now, and it’s still held back a little bit.
So, there’s going to be some pent-up demand, if this can break up to new highs.
My price target for ADP is going to be up to $250 a share. It’s trading around $170 a share today. So, we’re looking at roughly a 40%, almost 50%, rally for the stock here over 2021.
That’s what I’m calling for.
When we look at the stock, it seems a little crazy, after what’s been going on here in 2020. But just back in 2019, we had a slow start or a rough end to 2018. That helped mark the bottom. And then, it was able to rally in 2019 for a 45% gain.
I think 2021 is setting up pretty similarly. We’ve had a rough 2020, and even the stock market is back up to new highs. And I think it could set up for another roaring 2021.
As we have a new president coming into office, they’re going to introduce new stimulus packages. That’s going to help boost the stock market in that first year of presidency. From there, we’ll have to take a look, as things could change. But just over 2021, I’m pretty bullish.
Regards,


Chad Shoop, CMT
Editor, Quick Hit Profits