


The best moving average for day trading is the one that keeps you aligned with momentum instead of pulling you into late, emotional decisions.
Moving averages are not prediction tools and they are not magic indicators.
They are structure tools that help day traders read direction, speed and pressure in real time so price action makes sense as it unfolds.
You can use the best moving averages to spot momentum, manage risk, and time entries and exits with precision instead of guessing.
Day trading moves fast, and without structure, most traders end up reacting to noise instead of real opportunity.
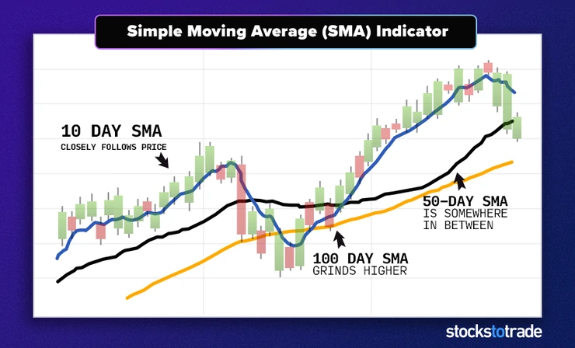
A moving average smooths price changes so trend direction, and momentum become visible across a short-term timeframe.
In my trading and teaching, moving averages are never treated as standalone trading signals.
I use them to frame the market first. Is the stock trending or ranging? Is the price respecting levels or chopping through them?
That context keeps traders from chasing random candlestick patterns without confirmation.
Day traders who skip moving averages often trade against momentum without realizing it.
A clean chart with well-chosen averages creates boundaries, improves discipline and supports a repeatable trading strategy that can be refined over time.
Filtering Market Noise vs. Identifying Trend with Moving Averages
Filtering market noise versus identifying trends with moving averages starts with understanding what noise really is.
Noise is random price movement without follow-through, often caused by low volume or indecision.
In day trading, noise increases during midday ranges, weak opens or low participation periods.
A moving average filters that noise by weighting price data over specific periods, making the real direction easier to see.
Trend identification comes from how the price interacts with the moving average, not the line itself.
In an uptrend, the price holds above the EMA and uses it as support. In a downtrend, the price stays below and rejects it as resistance.
This behavior repeats across stocks, timeframes, and market conditions.
I teach traders to focus on slope and separation.
A flat moving average signals a range. A rising or falling average with clean price action signals momentum.
That filter alone cuts out a large percentage of low-quality trades.
Best Moving Averages for Day Trading
The best moving averages for day trading are the ones that match how fast you trade and how you manage risk.
There is no single perfect setting that works in every market.
Different averages serve different purposes, from short-term momentum to broader intraday bias.
Day traders should think in layers, not in single choices.
In my own trading, I rely on a small group of moving averages that repeat across strategies.
Fast EMAs help with entries and trade management. Mid-range averages define trend structure. Longer-term SMAs mark major levels watched by other traders.

Source: Stocks To Trade
Using too many indicators creates confusion, not clarity.
The goal is to read price, volume and direction faster than the crowd. The right moving averages support that goal without replacing price action or risk control.
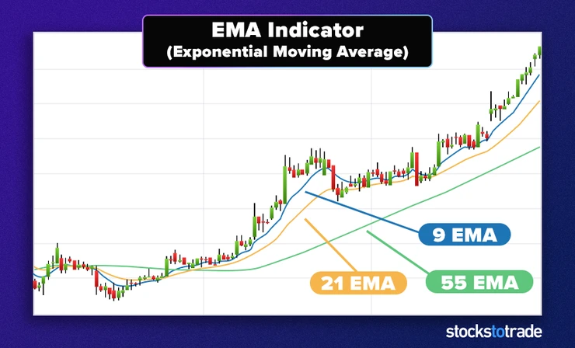
The 9 EMA: The Scalper’s Guide
The 9-day EMA is a short-term moving average that closely tracks momentum.
For scalpers and very active day traders, it acts like a real-time gauge of price pressure.
Because it is exponential, it gives more weight to recent price changes, making it responsive during fast moves and high volatility.
Source: Stocks To Trade
In strong trends, price often pulls back to the 9 EMA before continuing.
That behavior creates repeatable entry opportunities when volume and candlestick confirmation align.
When the price loses the 9 EMA and fails to reclaim it, momentum is often fading.
I teach my students to use the 9 EMA only in trending conditions.
In a range, it produces whipsaws and false signals. Used correctly, it helps traders stay with winning moves instead of exiting too early.
The 20 EMA: The “Fair Value” Line
The 20-day EMA often acts as a fair value line for intraday trading.
It balances speed and stability, making it useful across multiple timeframes and strategies.
Many day traders use it to judge whether the price is extended or still offering an opportunity.
In an uptrend, pullbacks to the 20 EMA often act as support. In a downtrend, it becomes resistance.
This makes it useful for planning entries, exits, and trade management when combined with volume and overall market direction.
Having patience around the 20 EMA is a recurring theme I teach.
Chasing a price far from fair value usually leads to poor risk. Waiting for the price to come back improves reward-to-risk and reduces emotional decisions.
The 50 EMA: Defining Intraday Sentiment
The 50-day EMA helps define intraday sentiment and trend strength.
It moves slower than short-term averages and separates strong trends from weak ones.
When price holds above the 50 EMA, buyers are in control. When the price stays below it, sellers dominate.
Because many professional traders watch the 50-period average, it often carries extra weight as a technical level.
Breaks and reclaims of the 50 EMA frequently lead to momentum shifts and larger intraday moves.
I use the 50 EMA as a bias filter. Long setups below it require lower expectations.
When price reclaims it with volume, bias can flip quickly. That awareness helps traders adapt instead of forcing trades.
The 200 EMA: The Institutional “Line in the Sand”
The 200-day EMA represents long-term bias even on intraday charts. It is widely followed across markets, stocks, and timeframes.
Because so many traders watch it, price reactions around the 200 EMA are often sharp and decisive.
Price will either respect the level and reverse or break through it with strong follow-through.
That makes the 200 EMA valuable for planning exits, stop placement, and larger directional trades.
In my experience, traders who ignore the 200 EMA often trade directly into heavy pressure.
I teach traders to treat it as a line in the sand. Trading with it improves alignment. Trading against it requires tighter risk and faster decision-making.
High-Probability Moving Average Strategies for Day Trading
High-probability moving average strategies for day trading are built around alignment, not prediction.
Moving averages work best when they agree with price action, volume, and overall market direction.
When those factors line up, trading signals become clearer and offer more security.
I always focus on simple strategies that repeat across different stocks and sessions.
Complexity does not improve performance. Consistency does.
Moving averages help create rules around entries, exits, and trade management without emotional interference.
You should test strategies in real market conditions.
A setup that works well in trends may fail in a range. Knowing when to use each strategy separates disciplined traders from gamblers.
Bottom Line
Moving averages provide structure, not predictions. The best moving average for day trading depends on your timeframe, strategy, and risk tolerance.
EMAs react faster. SMAs define broader levels. Fewer tools create clearer decisions.
Risk management comes first. A moving average will not fix a bad trade. Discipline will.
This is a market tailor-made for traders who are prepared. Day trading thrives on volatility, but it’s up to you to capitalize.
Stick to your plan, manage your risk, and don’t let FOMO drive your decisions.
These opportunities are fast and unpredictable, but with the right strategy, you can make them work for you.
Trading is a battlefield. The more knowledge you have, the better prepared you’ll be.
If you have any questions, email me at SykesDaily@BanyanHill.com.
Cheers,

Tim Sykes
Editor, Tim Sykes Daily
