
A year ago, I warned that the next recession would begin in the first half of 2019.
I also noted that stock prices usually start falling “an average of six to 12 months before the recession.”
That means it’s time to be on the lookout for a bear market.
One sign is a breakdown in the market leaders, which I highlighted a week ago.
Just five stocks have accounted for most of the gains in the S&P 500 index this year. Those five, Facebook, Apple, Amazon, Netflix and Alphabet, the parent company of Google, are known as the FAANG stocks.
My warning was based on the VIX Flip indicator. That warning was timely. As stocks declined recently, the FAANGs fell 14.9%, nearly double the loss of the S&P 500.
The VIX Flip also allowed me to recommend put options to Precision Profits subscribers on October 8, two days before the S&P 500 dropped more than 3% in a single trading session.
Put options give the buyer the right to sell 100 shares of a stock or exchange-traded fund at a specified price at any time before a predefined date. With puts, we can benefit from price declines.
Within two days, my subscribers recorded gains of more than 50% on their options.
Gains like that are good, but there’s even more money to make with put options. Based on my indicators, it looks like the bear market is just beginning.
The VIX Flip Indicator
The chart below applies the VIX Flip to monthly data for the S&P 500.
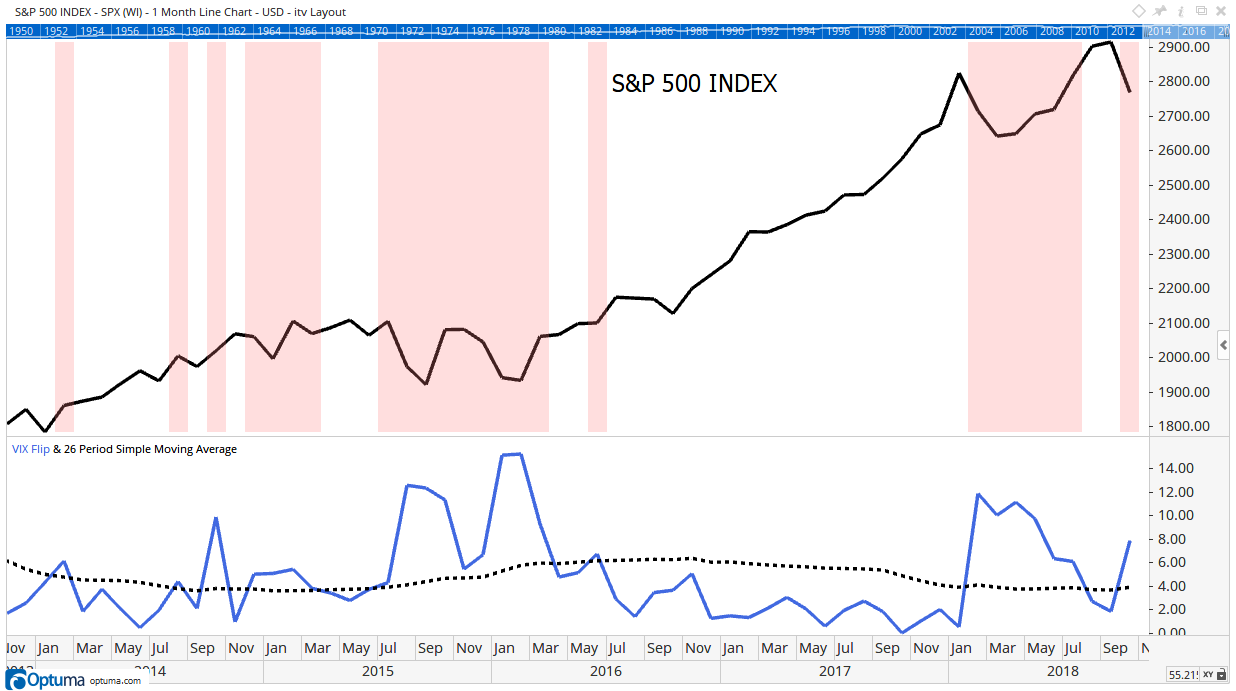
The VIX Flip shows changes in the emotions of traders. The indicator tracks fear. When the indicator moves higher, the level of fear in the market is rising.
In the chart, the dashed line is a moving average of the indicator. The moving average smooths out day-to-day swings. It shows the trend. It also lets us see when the trend changes.
By adding a moving average to the indicator, we can spot when emotions change. When the indicator moves above its moving average, fear is rising. That’s time to sell.
If fear is falling, the indicator drops under the moving average. That’s a buy signal.
The VIX Flip just crossed above its moving average. This tells us to expect a decline in the index over the next three months. After a signal like this, there was a decline of at least 10% in the S&P 500 75% of the time.
Many declines went much further than that.
Prepare for the Worst
This indicator gave sell signals before bear markets in 2000 and 2008. It’s one of the few indicators that warned of the October 1987 market crash.
Applied to the Dow Jones Industrial Average, the VIX Flip warned of the crash in October 1929 and other historic bear markets.
This is a reliable indicator, and it’s telling us to prepare for the worst in the next few months.
It’s not telling us stocks will drop 50% or that the financial system is collapsing. It’s simply saying risks are high, and a decline of at least 10% is on the way.
But the decline could be worse than that since a recession is starting soon.
Regards,

Michael Carr, CMT, CFTe
Editor, Peak Velocity Trader