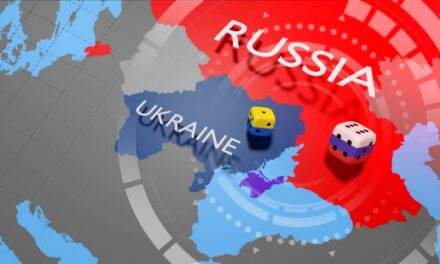
When I saw pictures of Russian Grad rocket launchers massing along the Ukraine border, I knew Russia was committed to action.This weapon system is highly mobile.It’s basically a truck with rockets in the back.But there are a lot of moving parts on that system.There’s the truck, of course. Then each rocket. And the mechanism that supports aiming and firing.In the military, all parts need maintenance. That’s especially true in bad weather.

Source: DailyMail.co.uk
All that maintenance requires people. And the people grow more and more uncomfortable in the field.Now, weather in the Ukraine this week isn’t terrible. The temperatures are in the 30s and clouds seem to be common in that region. But that’s not the kind of weather that troops enjoy sitting around in.Given all this, I knew Russia would have to do something soon. Within weeks they would have to move forward or pull back and return to base.Unfortunately, they chose to advance into Ukraine…
My insights into that dynamic are based on my time in the military. My unit deployed a more capable platform, the High Mobility Artillery Rocket System or HIMARS.I knew these weapons can’t sit in the field indefinitely. I also knew troops complain in bad weather. We trained in Wyoming where the wind and rain were constant. We deployed to Iraq where the heat was a persistent topic of conversation.Even the most gung-ho troops admitted how bad it was when they said things like “I love that it sucks so much here.”My time in the military taught me that it’s important to study history. From personal experience, I learned that troops can’t sit at a high degree of readiness for long. History provides examples when time and weather combined to destroy armies, like the Germans in Russia in World War II.This told me to expect something from Russia soon. I also learned that history is important to study in the stock market.Russia’s attack, so far, seems in some ways similar to the last time war started in Europe when Germany invaded Poland in September 1939.The chart below shows the S&P 500 from that time.

(Click here to view larger image.)
At the bottom of my chart is a volatility indicator that I developed and am continuing to research. It acts like the Volatility Index (VIX), so it rises when prices fall.Low readings are bullish. Signals are generated when the indicator crosses its moving average, the thin line in the chart.Crosses below the MA are buy signals. Remember, this indicator is like the VIX, so declines are associated with rising prices.This is a fairly active indicator that tends to avoid the worst of the steepest declines. Keep in mind that, as this is a daily chart, the signals on this chart will be a bit longer-term than something on an hourly chart. I generally use a weekly chart to find the long-term trend.For example, the sell signal in August 1939 avoided the decline that came as German tanks and planes launched their blitzkrieg. The buy signal came when the U.S. affirmed its neutrality on September 5, 1939.That’s a historical example. Now let’s look at today.
Check out this weekly chart of the S&P 500…

(Click here to view larger image.)
This indicator gave a sell signal on January 14, about 10 days after the S&P 500 peaked.While we seem to be weeks away from a new buy signal, there will be shorter-term signals that will help me to navigate the volatility we should expect for at least the next few weeks.These signals come from different ways I use the indicator. For example, I apply different indicators like the Relative Strength Index (RSI) to this tool. I also measure how far the indicator is from its average. I’m still researching these techniques and will have much more to share with you in the next few months.When it comes to Russia, I do expect a fairly quick resolution to this conflict. Russia doesn’t seem to want World War III. Putin wants Ukraine. World leaders want this to end.Watch for an announcement that Russia agrees to stop its advance. This will come after Ukraine suffers large losses.If we see that outcome, every global leader except for Ukraine’s president will claim that they won.And those announcements should trigger a buy signal on my indicator. Of course, that’s only my expectation.I trade the market I see, not the one I want to see. I’ll adapt as events unfold.Regards, Amber HestlaSenior Analyst, True Options Master
Chart of the Day:Small-Cap Recovery Dead Ahead

(Click here to view larger image.)
Reading Amber’s initial draft got me thinking about her and Chad’s call that small caps would beat the market in 2022.So far, that hasn’t exactly panned out. The SPDR S&P 500 ETF (SPY) is down about 10.6% since the start of 2022. The iShares Russell 2000 ETF (IWM) is down about 12%.But, the year is far from over. And small-cap stocks look due for a serious recovery, spurned by today’s big reversal.You know what I’m seeing here. Big divergence on the momentum indicators. 9- and 20-day MAs that are happy to hang out. They’re slowly coiling up, even with prices at virtually the same level as a few weeks ago.Like Amber says, keep a close watch on the headlines for a quick resolution to the Russia conflict. If that’s what we get, stocks are set to fly. And all the reasons that Chad and Amber liked small caps back in December haven’t really changed.If you’re looking to bid something here, you could do a lot worse than small caps. Long-dated calls on IWM are a good bet if you agree.Regards, Mike MersonManaging Editor, True Options Masters