
Value investing is based on a good idea. Buying cheap stocks can be rewarding. The problem is defining what’s cheap.
Popular tools like the price-to-earnings (P/E) ratio can spot value but can also lead investors to disaster. The problem with low P/E ratio stocks is that sometimes they deserve a low P/E ratio. A company should be cheap, for example, when it’s headed to bankruptcy.
Even though there are shortcomings, the P/E ratio is useful. And with a small modification, it can become powerful.
The PEG Ratio
Value investors tend to ignore the fact that different stocks should have different P/E ratios. They may say a stock is cheap when the P/E ratio is under 10. But if the company is failing, it deserves a single-digit P/E ratio. On the other hand, a company growing rapidly deserves a high P/E ratio. Growth companies could be bargains with a ratio of 30.
There is a tool that adapts to the company’s prospects. The PEG ratio is an indicator that can help find true value. This ratio divides the P/E ratio by the earnings growth rate. Analysts apply it in a way that recognizes that high P/E ratios are appropriate for high-growth companies. A low PEG ratio highlights undervalued opportunities, no matter what the P/E ratio is. A high PEG ratio warns of overvaluation, and this indicator shows that even low P/E ratio can be overvalued.
Stocks are trading at fair value when the PEG ratio is equal to 1. This means the P/E ratio equals the earnings growth rate. For a stock growing earnings at 10%, the P/E ratio should be 10. When earnings growth is 40%, the P/E ratio should be 40. This stock’s a buy even if the P/E ratio is 30.
PEG ratios won’t work with every stock. When earnings growth is negative, for example, the PEG ratio isn’t the right tool. For those companies, the average dividend yield approach could work. But, for companies with earnings growth, investors can find value with the PEG ratio.
PEG ratios can also pinpoint value in sectors. When the ratio is less than the market’s PEG ratio, the sector is undervalued. In the table below, undervalued sectors are highlighted in green. These sectors have PEG ratios at least 10% below average. Red shading shows overvalued sectors. These are sectors with PEG ratios at least twice as high as the market’s ratio.
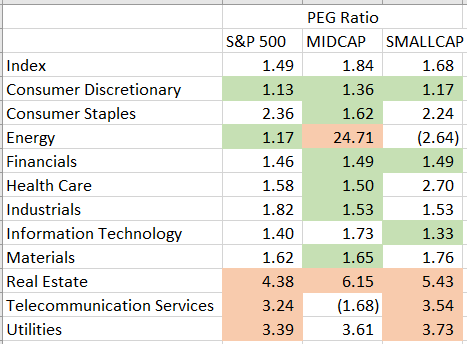
From the table, we can see mid-cap stocks offer the best value right now. However, consumer discretionary stocks stand out in all market caps. This sector includes large-cap names like Home Depot Inc. (NYSE: HD) and Tiffany & Co. (NYSE: TIF). In the mid-cap sector, iRobot Corp. (Nasdaq: IRBT) and Dave & Buster’s Entertainment Inc. (Nasdaq: PLAY) are representative of the sector. There are also exchange-traded funds offering exposure to the sector, including the Consumer Discretionary Select Sector SPDR Fund (NYSE Arca: XLY) and the PowerShares S&P Small-Cap Consumer Discretionary Portfolio (Nasdaq: PSCD).
In the current market, overvalued sectors are the ones often bought for yield. Investors could be paying too much for utilities and real estate investment trusts that offer high dividends. It’s usually best to avoid overvalued sectors and stocks.
Overall, PEG ratios are advising caution in the current stock market. There are several undervalued sectors and plenty of good stocks. But, at current prices, broad-based index funds may deliver below-average returns in the future. As the PEG ratio table shows, there is a wide range of value in the current market.
Regards,

Michael Carr, CMT
Editor, Peak Velocity Trader