

Two months ago, on Christmas Eve, procrastinating shoppers rushed out to finish (or start, in some cases) their holiday shopping.
Yet, as Target, Macy’s and Walmart drove foot traffic with deep discounts, the real holiday deals were lurking on the floors of the New York Stock Exchange.
December was looking like a December to remember (or forget), as the S&P 500 Index was down 13.63% at Christmas Eve’s close.
A close at those levels would have marked the worst month to end the year since 1931, in the throes of the Great Depression.
Investors were getting sacks of coal for Christmas. And the total peak-to-trough decline since early October touched 20%.
I have often said that nothing changes sentiment as much as price. And nothing ruins holiday cheer like an end-of-the-year sell-off.
As the market dropped, so did sentiment. Fear and selling became inextricably linked together in a vicious cycle.
Prices dropped, fear rose … which, in turn, brought out more sellers, leading to more fear.
This begs the question: How do astute investors determine when other investors are most fearful?
Fear and Greed
To “see” how others feel, you can make thousands of phone calls, or force them to take online surveys. But sometimes investors don’t admit how they really feel.
What’s needed is an indicator that will “judge me by what I do, not by what I say.”
One of my favorite ways to do this is CNN’s Fear & Greed Index.
This sentiment indicator provides a holistic look at whether investors are fearful or greedy. It judges them by their actions, not by what they think.
I check it daily. It’s invaluable in pinpointing turning points in the market.
Sometimes, I can’t believe they just give it away for free.
CNN’s reading accounts for seven key indicators that shows what investors are actually doing:
- Stock Price Breadth — the ratio of daily volume to advancing and declining stocks.
- Stock Price Strength — the ratio of stocks hitting 52-week highs vs. 52-week lows.
- Put and Call Options — the ratio of investors making bearish or bullish bets.
- Safe-Haven Demand — the relative performance of stocks to bonds.
- Junk Bond Demand — the yield investors are willing to pay for weaker credits.
- Market Volatility — as measured by the CBOE Volatility Index (VIX).
- Market Momentum — the difference between the S&P 500 and its 125-day average.
On Christmas Eve, the sentiment reading dropped to a three-year low (and barely missed its lowest point since the financial crisis). On a scale of 0 to 100, the indicator was at 3, an reading of “Extreme Fear.”
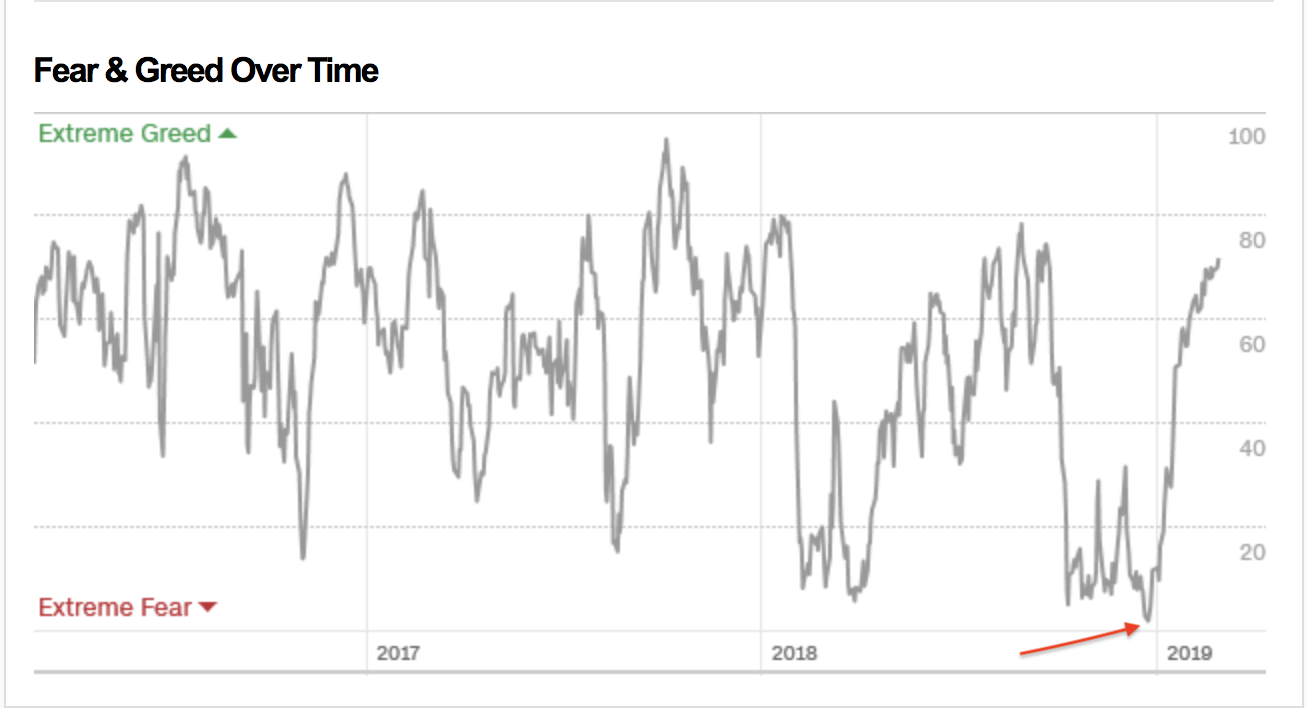
When sentiment hits extremes and investors are emotionally pricing assets, that’s when the best bargains can be found.
This helps investors follow the old “buy when there’s blood in the street” axiom by showing when fear is prevalent.
And guess what happened next?
The sell-off coupled with extreme readings in fear brought forth a massive rally to start the New Year.
Since Christmas Eve’s 2.7% shellacking, the S&P 500 has rallied 19.2% — almost as quickly as it dropped.
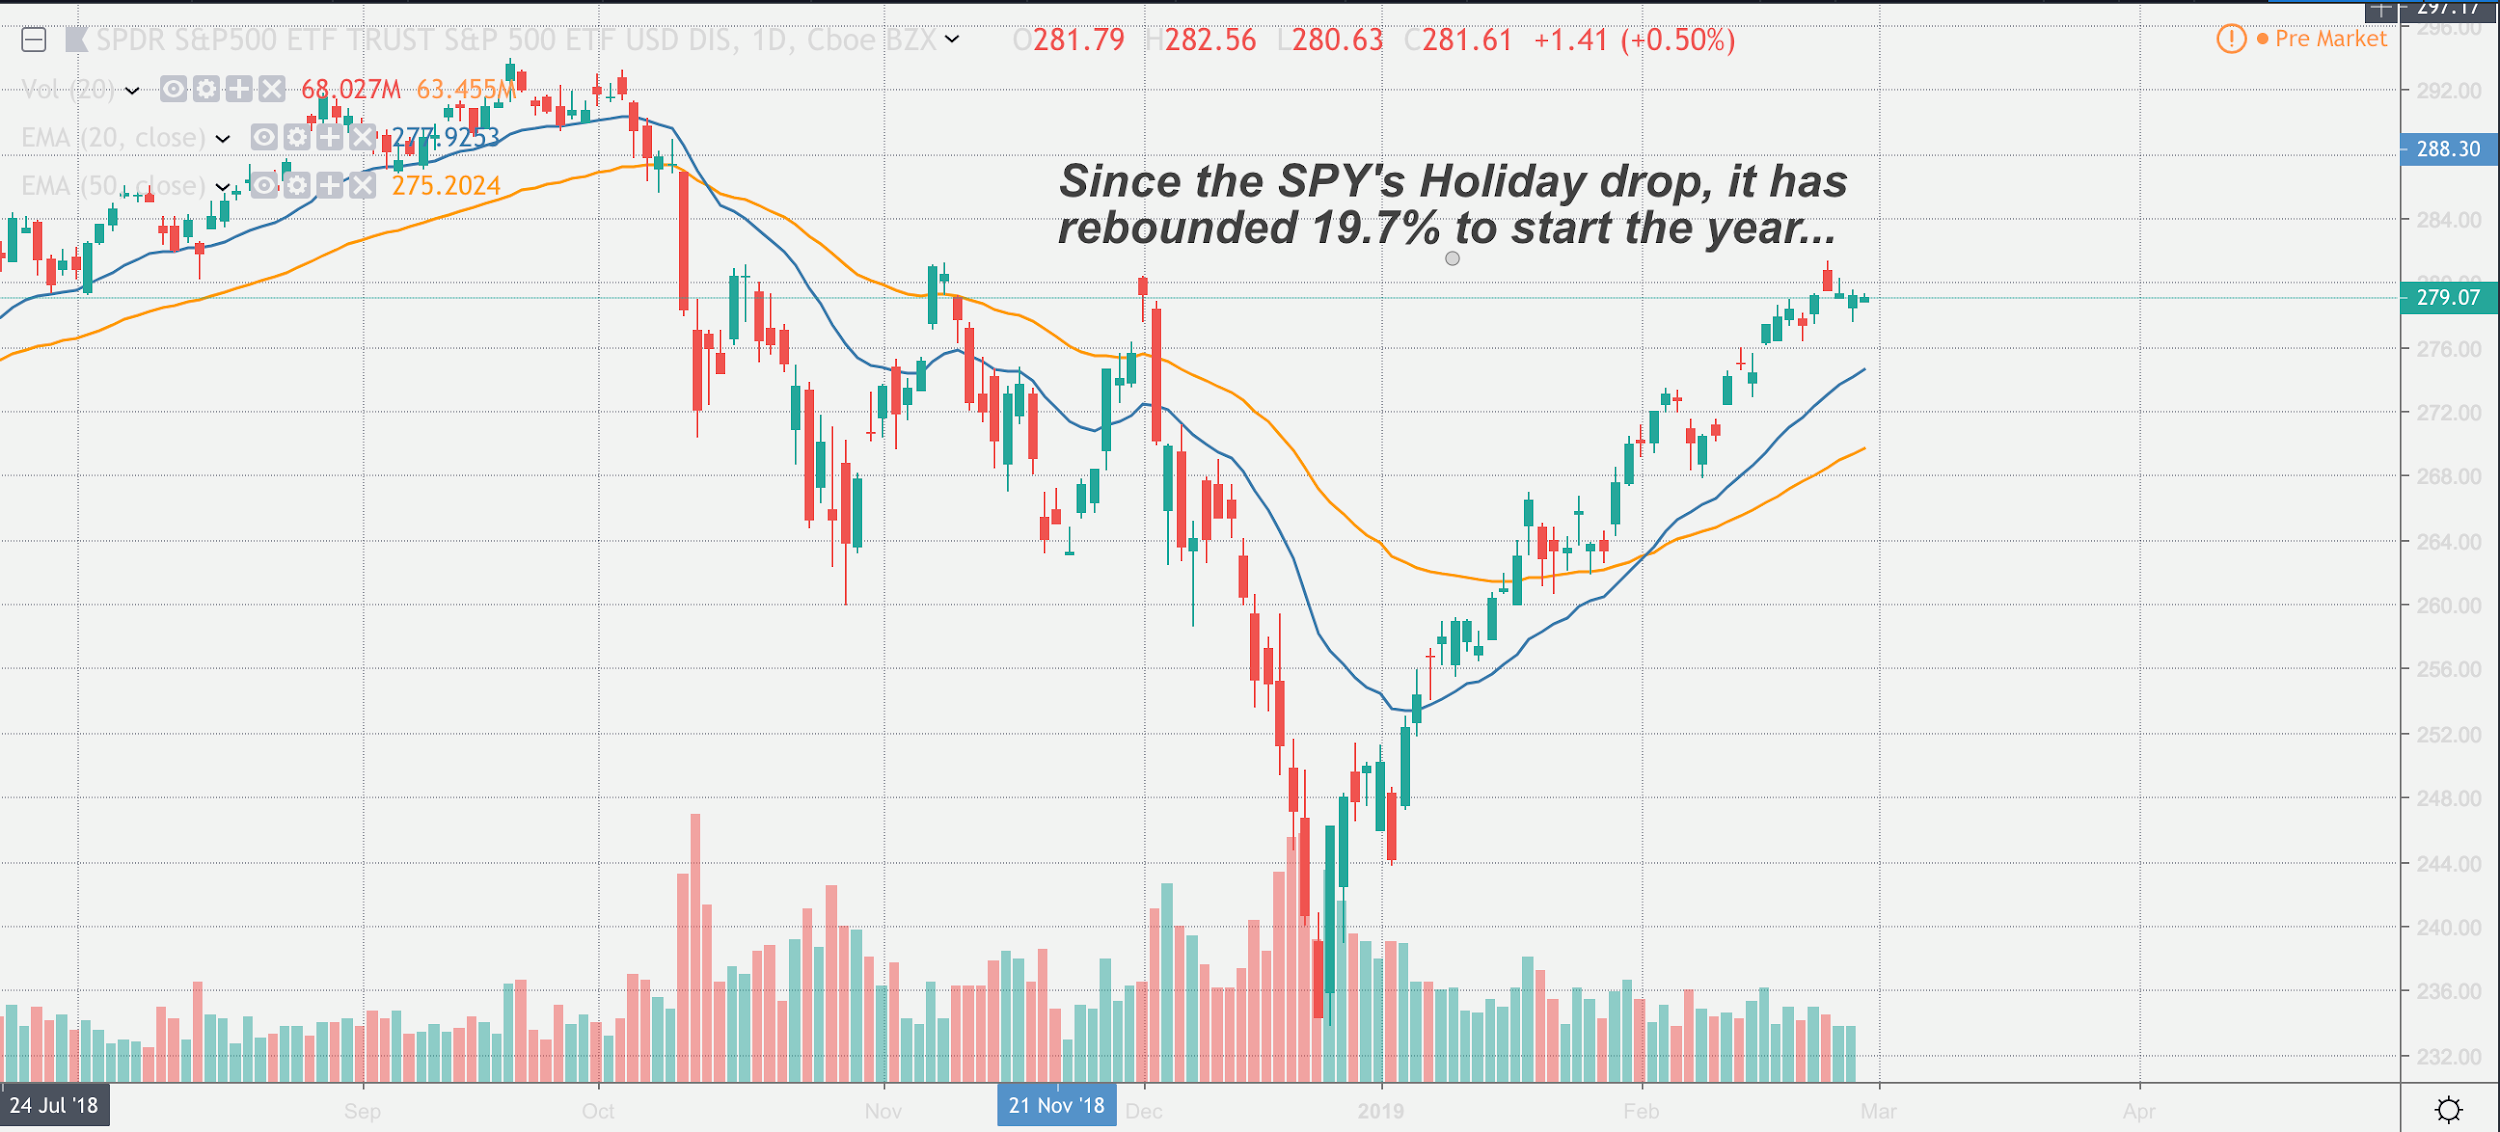
In the past four months, investors have been taken for a roller coaster ride, with a V-shaped 20% sell-off and a 20% rally. The V also stands for volatility.
Of course, as the market rallied off the Christmas Eve lows, the doubters came out of the woodwork.
“It’s a dead cat bounce.”
“There’s no volume to this rally.”
And my personal favorite: “The market is rigged!”
But if you followed the sentiment indicator, you would have realized that the market reached an inflection point in December and was overdue for a rally.
If you’re wondering what the indicator is now saying, here it is:
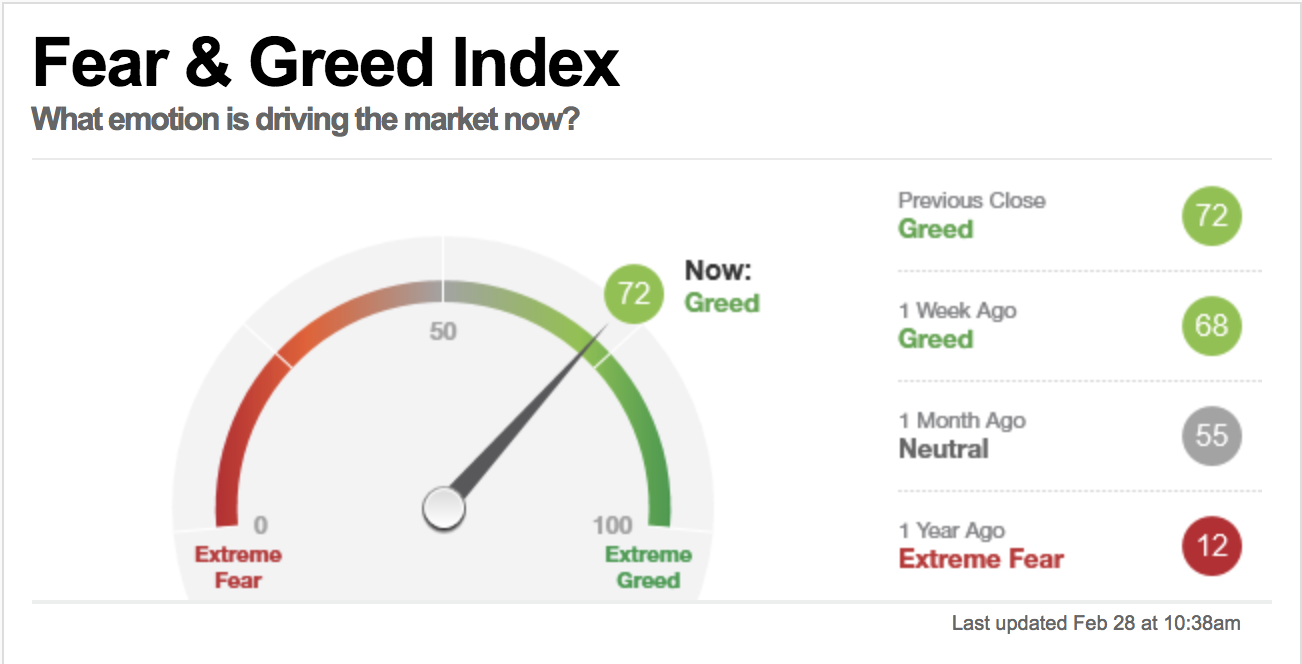
Investors are back to “Greed” territory. But that doesn’t mean the rally is over.
Remember, the market is in a perpetual cycle. And within these cycles, there is an imaginary pendulum that swings between fear and greed.
And just like Newton’s third law of motion — “for every action there is an equal and opposite reaction” — this pendulum swing likely won’t stop until it reaches “Extreme Greed.”
That means there is still upside ahead to this market.
The same investors who sold at the lows in December will be the ones to buy at the new highs at higher sentiment.
All of us have a family or friend like this.
They call you when the market is in the tank to ask if it’s a good time to sell, and then phone you at 52-week highs inquiring if it’s a good time to buy.
Successful investing requires buying when these people are looking to sell and selling when they are looking to buy.
Keep an eye on the sentiment indicators to determine when the time is right.
Regards,

Ian King
Editor, Crypto Profit Trader
P.S. If you’d like to stay up to date on technologies that are set to disrupt everyday life as we know it, make sure to join my Automatic Fortunes service. I have my readers positioned to profit as trends such as 5G, self-driving cars and precision medicine skyrocket. To learn how you can join today, click here.

