This week investors witnessed an event that hasn’t been seen in over a decade.
Many portend that when this phenomenon occurs, a recession may be looming.
This event is an inverted Treasury yield curve.
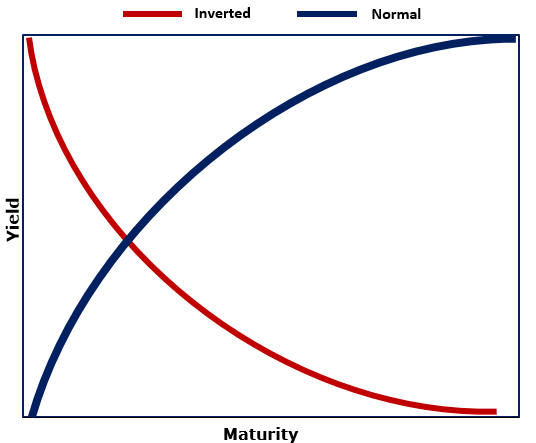
An inverted yield curve is a rare occurrence when short-term interest rates rise above long-term interest rates.

This inversion occurs when investors believe an economic slowdown is possible, so they seek longer-term investments for safer keeping.
This increased demand for longer-term bonds cause their yields to fall. That pushes yields on short-term notes and bills higher, making them more appealing to investors.
This is the first time the yield gap between the two- and five-year Treasurys has turned negative since before the Great Recession.
But a compelling chart posted by Bloomberg, courtesy of Sundial Capital Research, shows a different, bullish perspective.
The S&P 500 Has Room to Grow
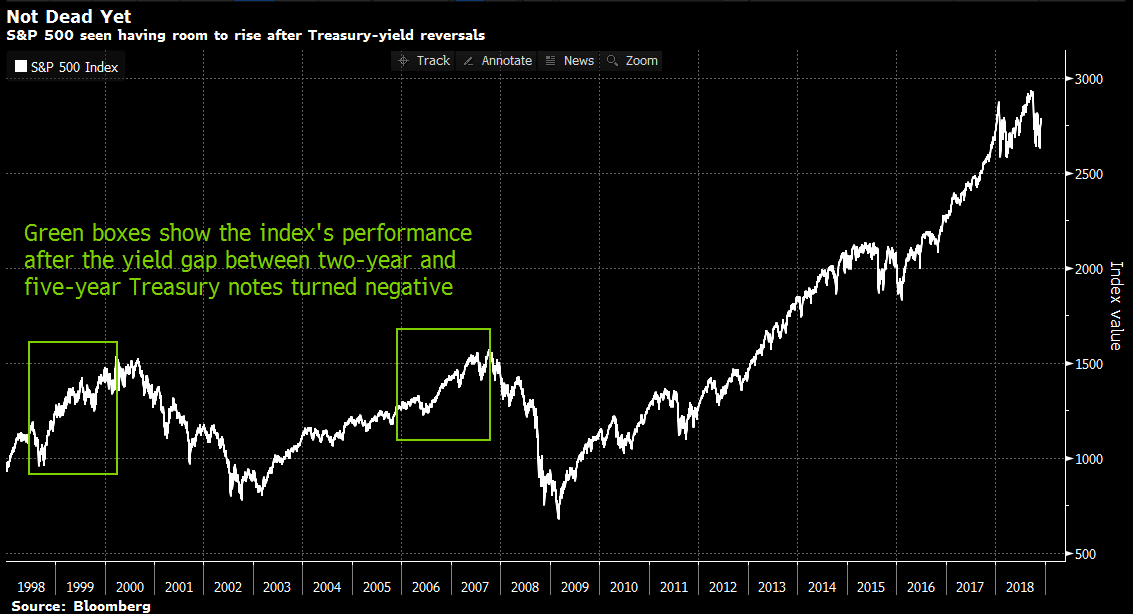
The chart below depicts how the S&P 500 Index performed after two past Treasury-yield reversals. The first noted reversal was in 1998, the second in 2005.
Per Bloomberg data, in both cases the S&P 500 continued to move higher for nearly two years before hitting its peak, capturing gains of 38% after the 1998 yield curve inversion and 24% post 2005’s yield curve inversion.
Of course, past performance is not indicative of future results. But this chart may predict that the S&P 500 has room to grow.

Until next time,

Amber Lancaster
Director of Investment Research, Banyan Hill Publishing


