Seasonality is one of my favorite technical indicators.
I use it constantly in my analysis of the stock markets, and I have developed an entire system dedicated to profiting from seasonality in the stock market.
Perhaps the single most famous seasonal trend is summed up in a simple saying: “Sell in May and go away.”
Seasonality
Normally I stick to that because seasonality is an important undercurrent on market sentiment.
But this year will be different.
And it’s the first time I’m bucking the typical seasonal weakness and saying this is an excellent buying opportunity.
I have spent the past few weeks analyzing what I expect to happen next for the overall market, and today I’ll explain how that led to my conclusion that the market is about to rally 20% before the end of the year.
Here’s why…
A Look Back at History
By now, you’ve probably seen dozens of articles covering the topic, each giving their two cents on how it will play out this year.
I wanted to do the same, but in context.
So I looked back at all the stock market corrections of 10% or more that occurred during the first four months of the year.
I went all the way back to 1960.
I wanted to see how the next six months, May through October, performed to see if it would give us an expectation on the six-month period we are currently in.
A correction in the first four months of a year occurred 17 times in the past 58 years, or nearly a third of the time. More often than I expected, but we know this isn’t that uncommon to start the year off on the wrong foot like we just did.
The exact circumstances would be different for each one, but looking at the corrections in general, they seem to have little impact on the direction of stocks from May through October.
However, I spent the time looking at the price chart for each year, and as I scrolled through them, one stood out — 1997.
This price pattern looked very familiar to what we just experienced: a rapid stock market rally and a quick correction at the start of the year.
That year, the S&P 500 rose 17% from May through October.
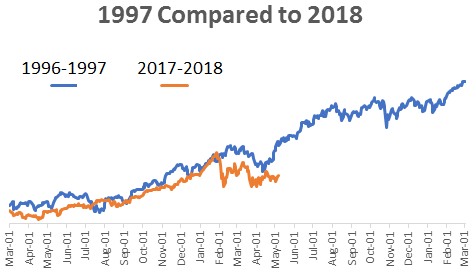
It came after the S&P 500 had doubled over the last five years, just like we recently experienced. But even looking at it in more recent terms, 1996 to 1997 looked similar to 2017 to 2018.
So I ran a correlation analysis to see how close the two time periods traded compared to each other, and the results were amazing.
They had more than a 0.9 correlation. A 1.0 correlation would be two identical time periods.
Stocks generally have a strong correlation, or one that is above 0.5. Once you are above 0.9, though, it is rare, especially over a 14-month period like I looked at.
And if you are still unsure how close the two traded, here’s a chart comparing the price patterns.

It’s pretty darn close, and even the correction has lasted about the same so far — roughly two months.
That’s why I expect a move higher any day now, and being invested now is the ideal time.
Now Is the Time to Buy
I’m aware this time could be different, and that the correlation could fall apart.
It’s why I’ll be watching my Chart of the Day from Friday closely. This has the key areas to watch and will help us trade the next big move for the S&P 500.
But until that breaks out, I am using this time to load up on some positions that will benefit from a rally in the stock market.
If you went to cash during the correction, now is the time to get back in and ride the pop higher.
So let’s flip the saying on its head this year, and we’ll “buy in May and sell in October.”
Not as catchy, but I’m just here to make a profit, not produce a new catchphrase.
We grabbed two 30% gains in Automatic Profits Alert last week, and with “sell in May” getting flipped this year, we’ll lock in many more gains in the months to come.
Regards,

Chad Shoop, CMT
Editor, Automatic Profits Alert


