Good traders know that history often repeats. The repeat is rarely an exact match to the past, but it usually follows history close enough to generate a trading profit. That’s why market analysts devote countless hours to studying history. And based on my studies, Russia might be the most interesting market in the world right now.
Russia is facing a budget crunch brought on by low oil prices. Russian armed forces are facing an increasingly contentious conflict that adds more strain to government resources. And the stock market was one of the best performers in the world the previous year.
That was all true in 1998. It’s also all true right now. The only real difference between the two times is the location of the military conflict. It was Chechnya in 1998, and it’s Syria today.
The relationship between the stock market in these two years is scary.
The Dreaded Double Top
The chart below shows the market action from 1998 in blue and the current market action in black.
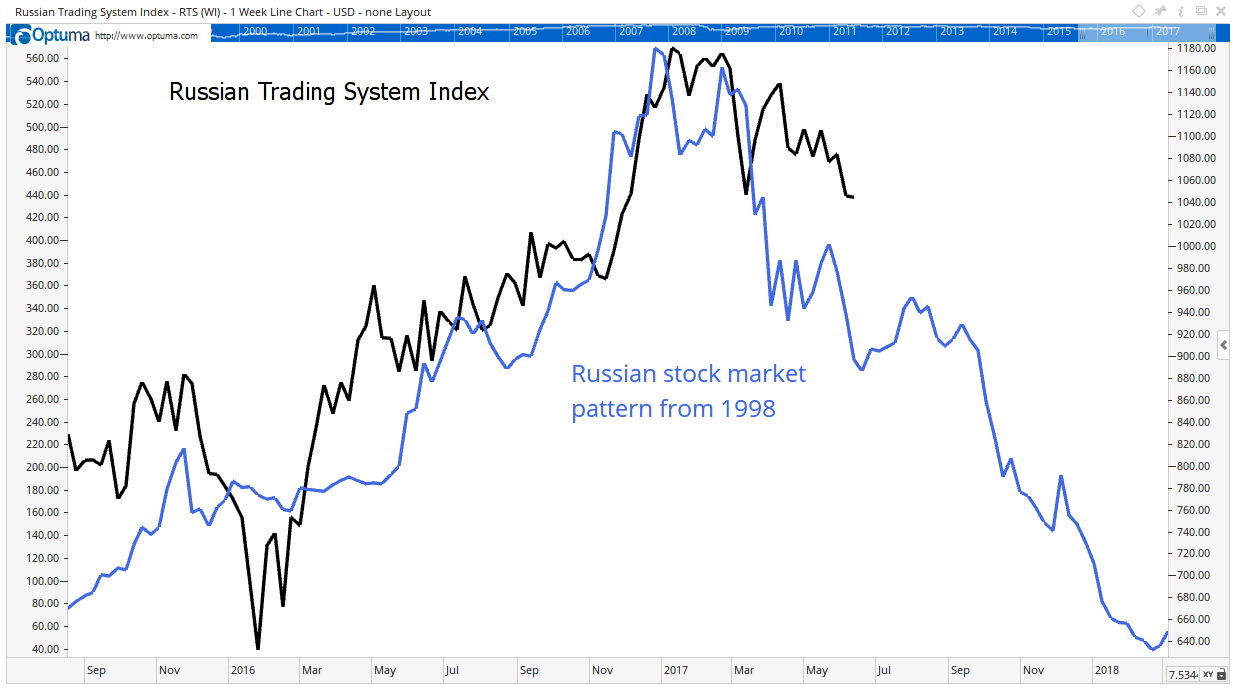
The Russian Trading System Index (RTSI) is a benchmark index for the country. In 1998, and again today, it shows the telltale pattern of many market crashes — a double top.
Market tops usually follow a historical pattern. Prices race higher, eventually accelerating at an unsustainable pace. In 1998, the bubble in prices peaked when the 12-month rate of change (ROC) topped 360%.
A level of 40% usually indicates a bubble is about to burst. At the beginning of this year, the 12-month ROC in the RTSI peaked at 60%. After the final burst higher, smart traders take profits, and prices start to fall.
This creates a pullback that looks like a chance to buy for investors who missed the run-up. They believe they are buying a dip, and prices usually rally as these investors pour money into the market.
But, soon, these buyers run out of money. Their buying stops, and prices turn down again.
A Dangerous Russian Bear Market
In sum, we have rapid gains leading to a top. Then smart investors sell, and prices fall. At this point, less-sophisticated investors spot what they think is a bargain. They buy, pushing prices back toward old highs. But they run out of money for buying, and then another decline begins. This time the decline is the big one, the bear market that always follows a bull market.
In the U.S., we saw that double-top pattern form in 1929, 2000, 2007 and at other important tops. It’s a pattern that can be costly to ignore.
As the chart above shows, the double top is in place in Russia. And that top looks a lot like the one that formed in 1998.
That year, the crash in Russia caused a worldwide market sell-off. Hedge funds were buying Russia back then, expecting the bull market to continue. When it didn’t, some hedge funds failed, and their demise led to declines in stocks around the world. In the U.S., the S&P 500 declined almost 22% in less than three months.
Could Russia break the pattern and rally from here instead of declining? Anything is possible in the markets, but history tells us caution is warranted.
History also tells us to be on the lookout for the problems to spread. Europe is Russia’s largest trading partner and could be the first region to feel the pain of a bear market in Russia. The United States is the European Union’s most important trading partner and would suffer if Europe does.
In an increasingly interconnected world, investors need to watch for potential problems everywhere. Right now, Russia tops the list of potential concerns. Smart investors cannot ignore Russia for long.
Regards,
Michael Carr, CMT
Editor, Peak Velocity Trader