
Traders love to talk about the markets in military terms. One of the most common analogies involves market breadth.
Breadth is a way to measure how many stocks are participating in a trend. In military terms, traders think of major market indexes as the generals in an army. Breadth measures how many troops are marching behind the generals. In this case, the individual stocks represent the troops making up the army.
The chart below shows that the troops are supporting their generals in the current market. This is bullish, and it tells us that more new highs lie ahead. In fact, we could see this market move higher for a few more years.
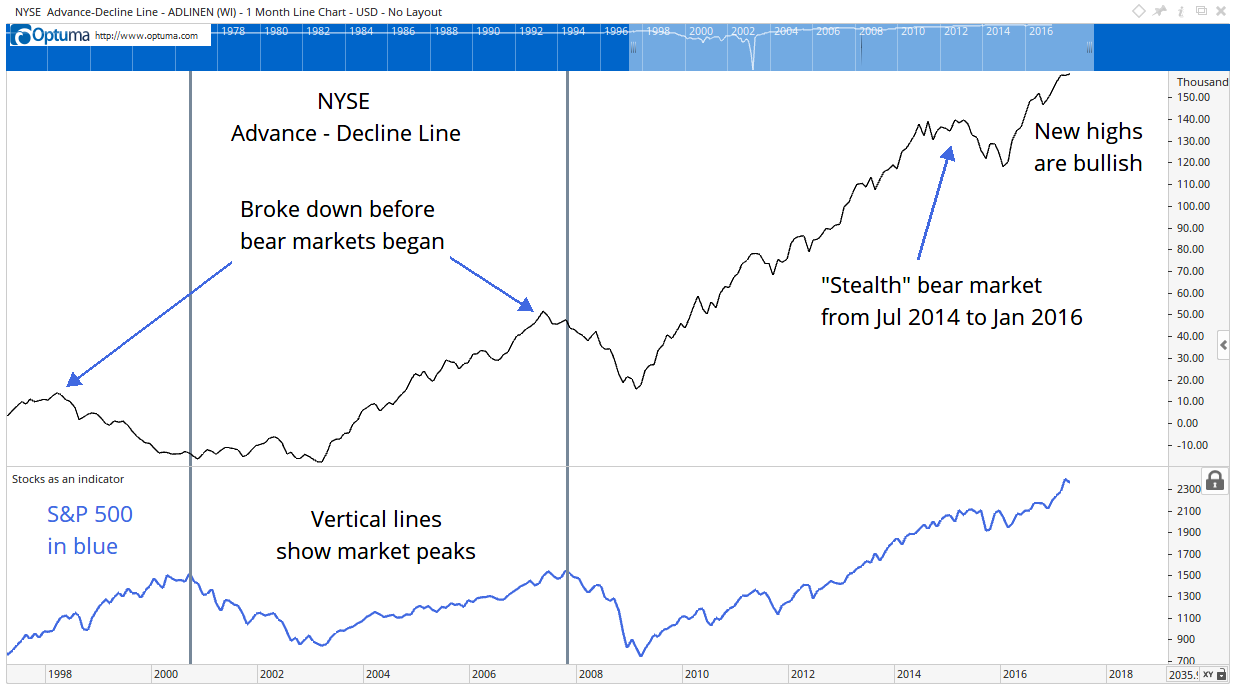
In the chart, the NYSE advance-decline (A-D) line is shown at the top. This indicator compares how many shares of stocks moved up versus how many shares dropped in price.
At the bottom of the chart, the blue line is the S&P 500 Index. Vertical lines show tops in the index. Notice that the A-D line was already in downtrends for months before the indexes turned down.
Some traders worry that the bull market is too old and claim we haven’t seen a bear market since 2009. This ignores the sideways action from 2014 through the beginning of 2016, where consolidation might have replaced a decline. That sets up a multiyear bull run in the stock market.
I’ll be watching the A-D line. When it breaks down, I’ll be worried. Until then, I’ll be bullish.
Regards,

Michael Carr, CMT
Editor, Peak Velocity Trader