
Technical analysts say a market is overbought when prices move up too fast. When a market’s overbought, everyone who wants to buy probably already has. This means the market is at risk of running out of buyers, and a decline is likely.
Over the years, analysts developed many tools to help decide when a market is overbought. Many of these tools don’t work very well. Among the few tools that stand up under the scrutiny of testing is the two-period Relative Strength Index, or RSI(2). It’s shown in the chart below.
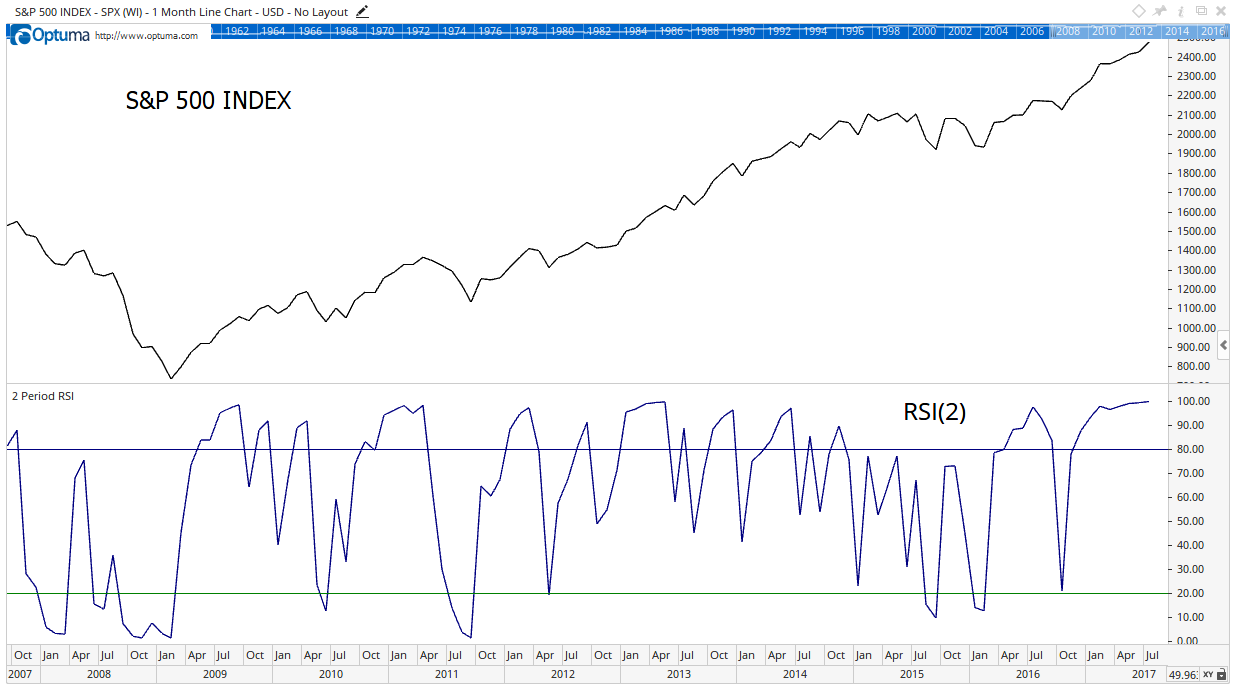
A market is overbought when RSI(2) moves above 80. RSI(2) uses just two pieces of data in its calculation instead of the RSI’s usual 14, and that makes RSI(2) more responsive and meaningful.
RSI moves between 0 and 100. The current reading on the monthly chart for the S&P 500 Index is 99.8, an unusually high reading. July is the second month in a row the indicator was above 99. That’s happened just eight times since January 1928.
On average, the S&P 500 declines a month after becoming this oversold. But those sell-offs have been brief. Six months later, the index gained an average of 8.4%.
If history repeats, we should expect a brief sell-off followed by a strong rally that could carry into the end of the year. Investors willing to take the risk that the coming sell-off is just a dip in the uptrend might be rewarded with large gains in the months ahead.
Regards,
Michael Carr, CMT
Editor, Peak Velocity Trader