

Story Highlights
- The last time we alerted you to a setup like this, you had the chance to earn 45% in 13 days.
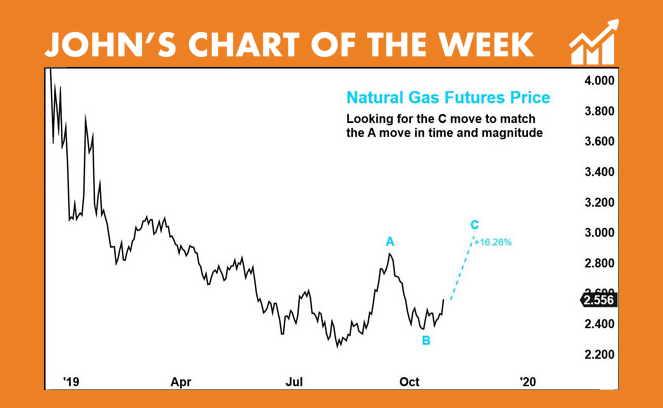
- John’s Chart of the Week predicts a move in natural gas prices.
- John shares a pure play on natural gas that you can make today — plus a great way to take advantage of other short-term price movements.
A new setup today offers investors who act fast the chance to earn a big windfall.
The last time we alerted readers to a setup like this, a leveraged exchange-traded fund (ETF) provided the chance to earn 45% in 13 trading days.
I’m talking about natural gas. You see, the price of natural gas bottomed in August and ran higher in September.
I expected money managers — hedge funds and institutions that bet on prices for profit — to change their minds about natural gas.
They did. And their behavior caused a rebound rally.
You can see what I mean in today’s Chart of the Week.
The long-term fundamental outlook remains bearish for natural gas. That’s why its price is so low.
But there are short-term opportunities to profit from the upside.
And trader behavior will cause the next rally as well. I’ll show you how to position yourself to take advantage of that price move.
An “AMP” Trade for Big Gains Before December
Back on October 14, I updated an article that covered the price movement for natural gas.
We’re seeing a repeat of that price pattern. The chart of natural gas above reveals how we can make money now.
I focus on the zigzag Apex Movement Pattern (AMPs).
You can see the pattern labeled A-B-C. My colleague Matt Badiali and I love to trade zigzags in our Apex Profit Alert system. You see, we created this system to take advantage of short-term price movements in natural resources.
Often, the AMPs we trade have three underlying price moves.
A zigzag rally is a move up, then a move down and another move up. Vice versa for a zigzag decline.
This pattern forms when traders respond to price action in a certain way:
- Traders get excited and buy into a new price move.
- Then they begin to doubt the move and sell to take profits.
- Finally, buyers jump back in until the behavior cycle is complete.
In the chart above, the rebound started the zigzag rally for natural gas — labeled A.
The decline — the second move of three — is labeled B.
I expect another move up. It will lift the price of natural gas to the point labeled C and complete the zigzag AMP.
This is a proven pattern analysis that’s helped us deliver consistent trading gains to our readers.
This rebound should happen in five or six weeks’ time. You can position for profits from natural gas in the coming weeks.
Ramp up Your Gains With Leveraged ETFs
When our stock analysis proves right, the price of natural gas will rise 16% in the next four weeks.
As I mentioned earlier, a leveraged ETF such as the ProShares Ultra Bloomberg Natural Gas (NYSE: BOIL) can double that.
BOIL tracks an underlying index of natural gas futures prices. That just means it’s a pure play on the price of natural gas.
I recommend using BOIL because a leveraged fund is a great way to magnify gains on a short-term price move.
Keep in mind that a leveraged ETF moves about twice as fast as the underlying natural resource price or stock index.
That means your gains will grow twice as fast when you win. But your losses will build twice as fast if you lose.
Not to worry — our proven system ensures the reward is worth the risk.
Now’s the time to place your bets.
But be sure to stay on top of this trade. If it materializes as expected, the move shouldn’t last into December.
Make sure you have an exit strategy in place to take gains or cut losses based on your personal risk tolerance.
Good investing,

John Ross
Editor, Apex Profit Alert
P.S. Matt Badiali and I have designed a system that allows you to turn a small move in a stock into a massive triple-digit win! Using our “buy on black” system, our readers locked in a string of gains including 163%, 79%, 320% and 72%. And it could trigger a new trade as soon as tomorrow! To learn more, click here now!

