If there’s one tool that all stock traders use, it’s moving averages. They’re popular, effective and simple.
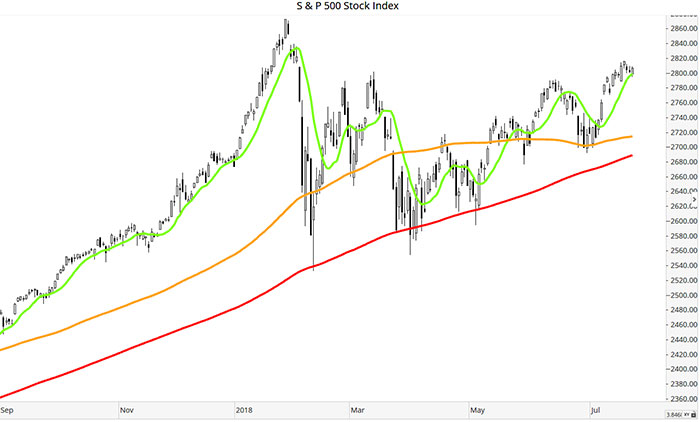
Each line represents an average of past prices. In the chart below of the S&P 500 Index, the green line is an average of the past 10 prices, the orange line is the past 100 and the red line is the past 200.
These are known as the 10-, 100- and 200-day moving averages, and they’re some of the most popular means of predicting how prices are going to move in the future.
S&P 500 Chart Resistance Levels

As you can see in the chart, there are plenty of times that the price of the S&P 500 seems to “bounce” off of these lines.
When the price is going up, reaches one of the lines and falls, it’s called a “resistance level.”
And when the price falls under one of the lines, the next one below it seems to be a place where the price goes back up. That’s known as a “support level.”
Even though we’re seeing crazy times in the market, with trade wars and political unrest, these lines seem to stand as legitimate trading tools.
For example, if you had been watching them last February and bought during the correction when the price fell to the 200-day average, you would have made a 10% return in less than four weeks. That’s about equal to the average return the market gives out in a year.
Right now, the 10-day moving average (the green line) is a very important place for the S&P 500. It just so happens to be right around the 2,800 mark, which the market surged through in January on its path to all-time highs.
While that was happening, people doubted that it would last long. And now we can clearly see that the stock market overshot it a little bit.
But six months later, it looks like the 10-day moving average, which served as a support level throughout that huge rally, could again be a level of support that the price will bounce off of to new highs.
Barring anything unexpected in the news, I believe the market will make new highs within the next month.
Regards,

Ian Dyer
Editor, Rapid Profit Trader
P.S. Over the last nine months alone, our Rapid Profit Trader research service has given our readers a chance at a return of 368%. Meaning, we’ve beaten the market 19-to-1 … while helping you turn every $10,000 into more than $40,000 in less than a year. This is why we’re reopening Rapid Profit Trader to new members at its lowest price ever for today only. Click here to lock in your access and get your first trade.


