

I held my hand over the big green “trade” button in the Robinhood stock trading app … but I hesitated. My thumb hovered in the air like a floating question mark.
See, I was buying a call option on Ford Motor Co. (NYSE: F). But the buy signal had come about a week before.
So I was faced with the question every investor encounters: Am I too late to get in?
It’s a familiar feeling — a hitch in your chest as you wonder if you’ve pinned down the right timing. The sigh, equal parts regret and relief, as you hold back trading an unsure prospect.
In fact, I’m sure many of you felt that common struggle with Apple Inc. (Nasdaq: AAPL) recently.
On Thursday, the tech company made history: It became the first U.S. firm to claim a market cap of over $1 trillion — an epic moment that came after it reported strong second-quarter results.
The stock surged almost 10% over three days as a result.
Many traders — the ones who held back on the “buy” button — were kicking themselves. They let the high price tag keep them out of the game this year, saying the stock was too expensive, even overvalued, and it wasn’t worth initiating a position.
It’s understandable. But since the beginning of the year, Apple has climbed over 20% from its $170 price tag. And there were plenty of opportunities to profit from that rise.
So how do you get over that fear of buying in at the wrong time?
I always suggest following a system that has a history of getting it right. For instance, I know of one momentum indicator that has avoided almost all of the declines in the stock market over the past 10 years by signaling when to get in and out.
And its average annual return is double the S&P 500 Index’s 11.5% average gain.
More to the point, it often knew when to get into Apple this year. In back testing, the system pinpointed four entry points since January:
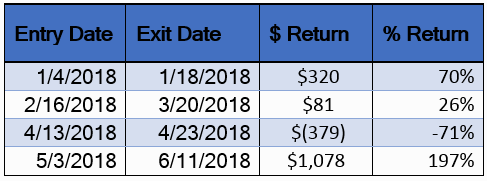
*Note: Results based on back test.
As you can see, by using this indicator, you could have made 222% in total gains, for an average gain of 55% in just over two weeks.
So not only could you have had clear signals of when to enter, you’d be doing light-years better than anyone who bought at the beginning of the year and held on for a 20% gain. (And, of course, you’d be doing better than those who didn’t press the “buy” button at all.)
So how does the indicator do that?
How to Find the Best Time to Trade
In a nutshell, this particular indicator gets triggered when a stock’s momentum signals it’s about to make a massive move. And when that momentum slows down, the indicator signals it’s time to exit.
That’s how it avoided almost all of the declines in the stock market over the past 10 years.
You can get a quick look of how it does that by watching the five-minute video below, recorded by Chartered Market Technician Michael Carr (the creator of the indicator). Right now, the indicator is saying the bull market is alive and well — and there will be plenty of ways to capitalize on it in the months ahead.
In fact, it just pinpointed two trades that are currently up over 100% in less than two months. To hear more, here’s the video:
In the end, sometimes we need a little guidance about the ideal moment to make a trade. It takes the emotion out of the equation, and keeps us focused on the data.
So I suggest putting a system in your portfolio if you don’t have one already. In fact, have multiple systems in your portfolio. After all, diversification is the real way to win this game.
If you’re interested in this particular momentum indicator, just click here to learn how to get access.
And for those who want to know if I pressed the “buy” button for Ford, I fought my fear and did it! Let’s see how it goes…
Catch you next week.
Regards,

Jessica Cohn-Kleinberg
Managing Editor, Banyan Hill Publishing

