I study charts daily, trying to find breakouts, trading patterns, and support and resistance zones.
I also lay data over charts and use other unique indicators to get a feel for what is guiding stocks or commodities.
Every now and then my son, who is about to turn 8, will walk past my monitors and start to explain what he sees on a chart — just things trending higher, or something that looks like a roof on prices.
Sometimes he even points out something I haven’t noticed yet.
And that’s exactly why I study charts; to wait for patterns to develop and to notice tendencies I haven’t noticed before.
Every time you look at a chart, you can see something different.
And I came across one recently that is signaling gold is about to break out.
A Breakout Point for Gold
Here’s the first chart I have for you today. In total there are three. This one is just the price of gold since 2008, showing the major resistance (green line) and support (red line) levels.
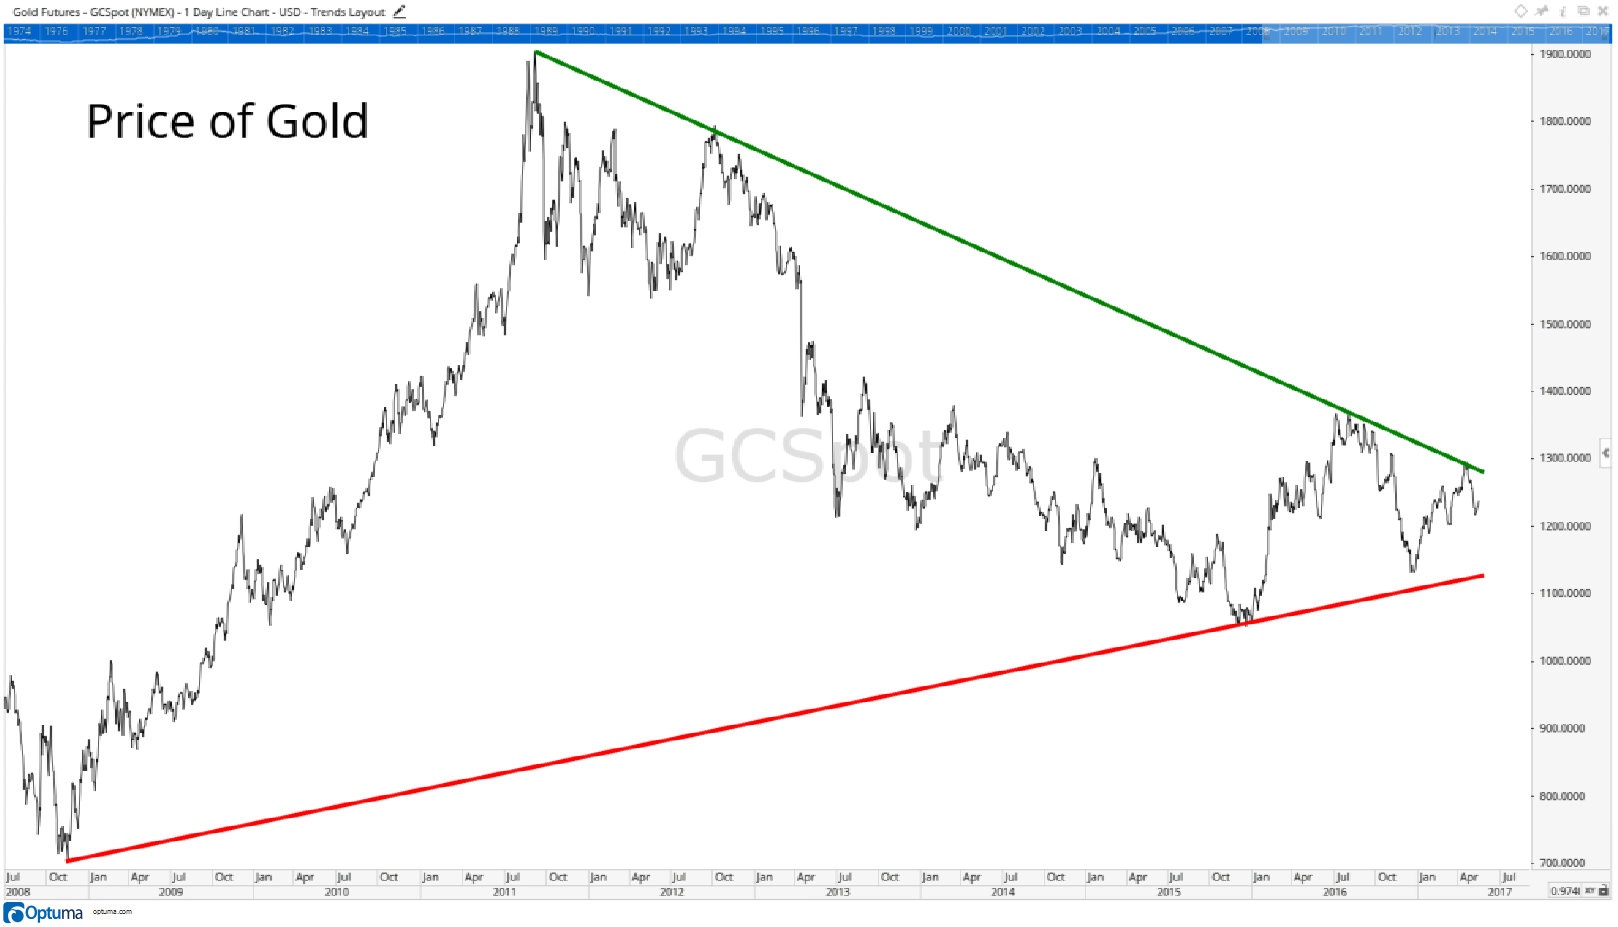
As those two lines converge, it depicts a breakout is imminent. On this long-term chart, it looks like a breakout could be sooner than later, but when we zoom in, there’s almost a $200 price difference between the two lines. This can bounce around and become even more narrow before a breakout occurs, which could even be in 2018.
Still, it’s something I track to confirm the breakout and the new trend in gold prices.
What I started digging into recently was the Commitment of Traders report’s data on gold. This is a report published weekly by the Commodity Futures Trading Commission that details the positions of large speculators. Optuma, my data source for the charts below, recently added all this lovely data in chart format for ease of use — and it has been fun to dig through.
What I noticed was that in May, hedge funds have been extremely active in placing bets on gold. In fact, in 2016, they had their largest long positions ever, but that has pulled back more recently, and dropped in May at the fastest pace since 2008.
That sounds bearish, but when you look at it on a chart, you’ll notice these sharp swings are common — but it also gives us a clue we are at a breakout point for gold.
Take a look:
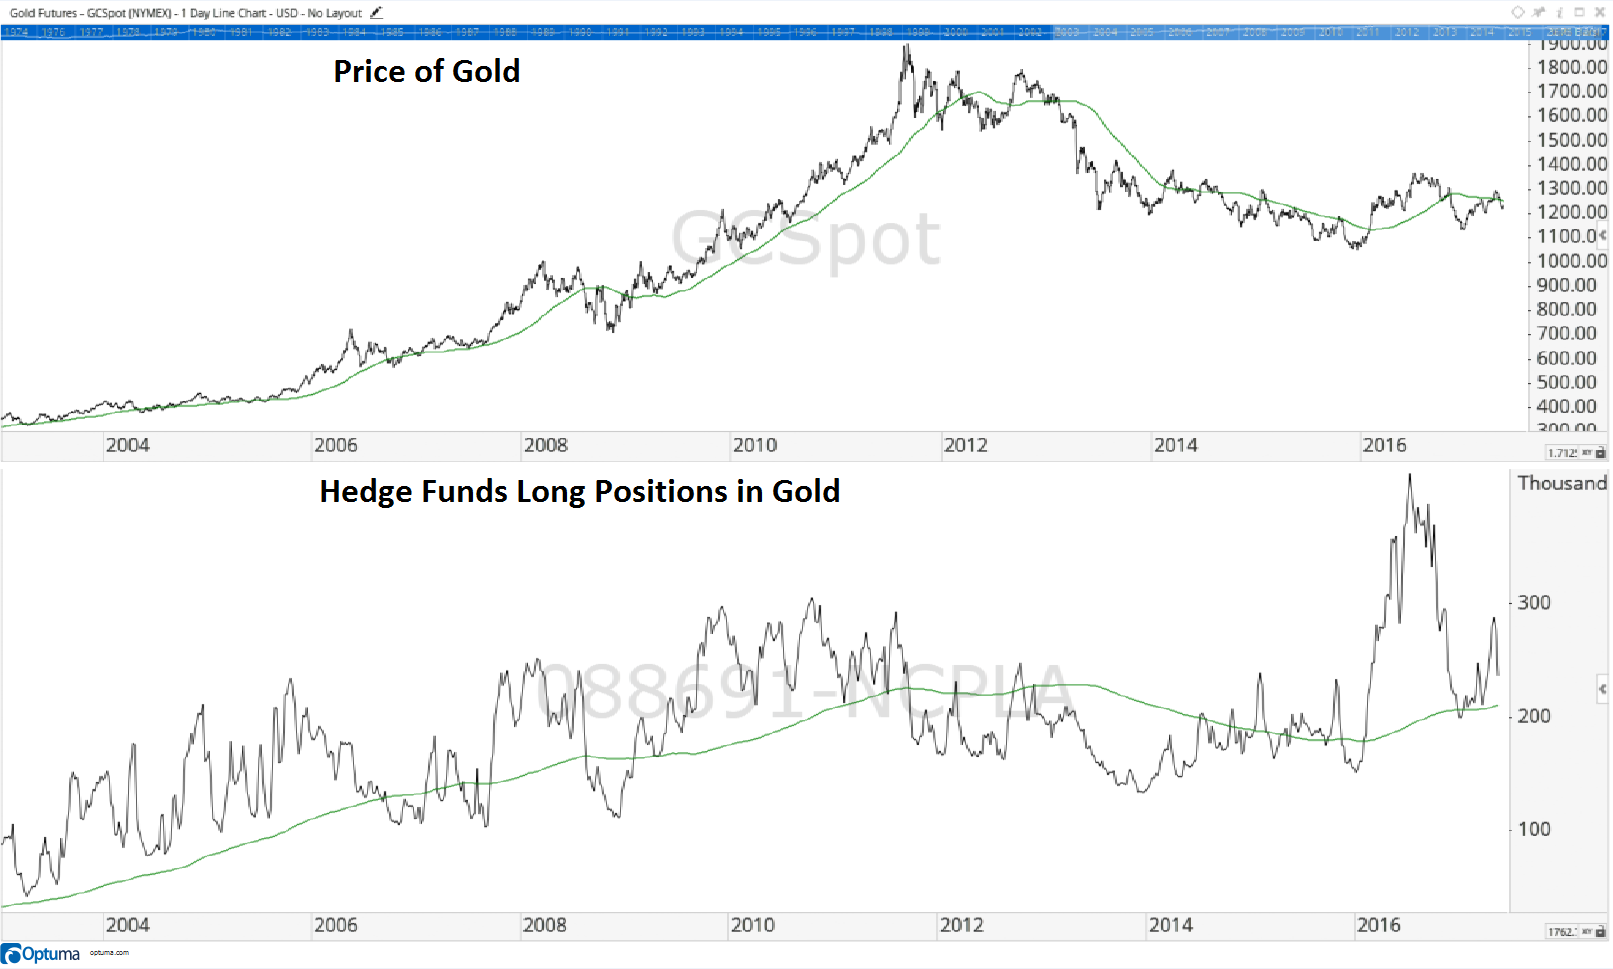
While it may be kind of difficult to see on that chart, what I noticed was that both price and long positions tend to trend in the same direction. The green line on each section of the chart represents the respective 200-day moving average.
So here’s another chart of the same image, just with arrows to help you identify the trends above and below the 200-day moving average.

As you can see, price and long positions are both trending along their respective 200-day moving averages at essentially the same time.
Now this is interesting.
Which leads which is hard to tell, but the easy argument is that the price of gold leads the hedge funds’ bets. As the price of gold rises, their long positions steadily accumulate. As gold prices fall, their long positions tend to shrink.
A Massive Rally Ahead?
So, what’s gold’s next move?
Well, it’s about to break out, as I mentioned earlier.
Which direction it will break out is what we are waiting to see.
The recent swings in hedge fund bets are so volatile that it shows they are eager to see gold break out as well.
Soon, price will confirm either a rally or another sell-off, and hedge funds will amplify that by shifting their bets in that direction.
This could be a moment like in 2008 when hedge funds were also volatile with the bets they were placing. Gold surged higher, and their positions adjusted accordingly.
As always, we will wait for the price of gold to confirm anything, but the next big move for gold could be a massive rally.
Regards,

Chad Shoop, CMT
Editor, Pure Income