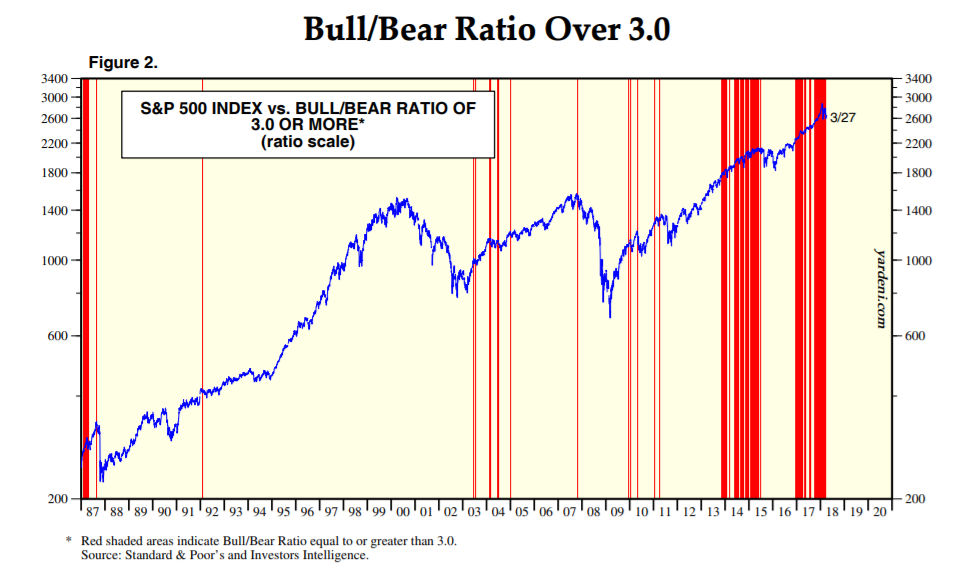
Bull markets climb a wall of worry. This means prices rise when traders worry. Unfortunately, there aren’t a lot of traders worrying right now.
We measure how worried traders are with a variety of tools. Among the most widely followed is a report released by Investors Intelligence.
That firm analyzes what market professionals are saying about the trend. Investors Intelligence assigns a rating to each report it reads.
Ratings are either bullish, bearish or looking for a correction. Most of the time, the report says little. Trade signals occur when the ratio of bulls to bears reaches an extreme level.
And that’s what we’re seeing today…
An Extreme Bull Market
There’s a sound explanation for indicators like this. When almost everyone is bullish, there’s not much money sitting on the sidelines. The bull market, in effect, ends when investors run out of money to buy more stocks.
One analysis of this report is in the chart below. Red bars highlight periods of extreme optimism. The blue line is the S&P 500 Index. Often, extreme bullishness precedes a sell-off in the index.

(Source: Yardeni Research)
The Investors Intelligence bull/bear ratio compares the percentage of bulls to the percentage of bears. Generally, there are about 25% more bulls than bears, so the average ratio is about 1.25.
Recently, the ratio topped 5 — there were 400% more bulls than bears.
That was the highest reading since 1987. That reading came before the S&P 500 lost more than 20% in one day.
This Sell Signal Is Flashing
Now, this isn’t a pinpoint timing tool. Stocks tend to drift higher after the number of bulls becomes extreme. That’s because the bulls run out of money and simply stop buying, but they don’t start selling.
Selling begins after prices fall from their all-time highs. At that point, all of the bulls who bought near the high show losses. Fear replaces optimism, and selling pushes prices down.
That’s where we are now. The number of bulls peaked in November, and the S&P 500 gained more than 11% after that peak. Buyers from that time now show losses, and they are growing more worried.
In recent weeks, the number of bulls dropped sharply. But there are still more bulls than bears. The most recent reading of the ratio was 2.83, indicating there are almost three bulls for every bear.
History tells us to expect a bottom when the ratio falls below 1. That could happen quickly, but it often takes time for bulls to throw in the towel.
This is just one indicator, but it’s flashing a sell signal. It means the end of the bull market is near, and we need to be ready for that.
Regards,

Michael Carr, CMT
Editor, Peak Velocity Trader


