Stock prices plummeted on Monday. After a sharp sell-off on Tuesday morning, the Dow Jones Industrial Average was more than 10% below its all-time high.
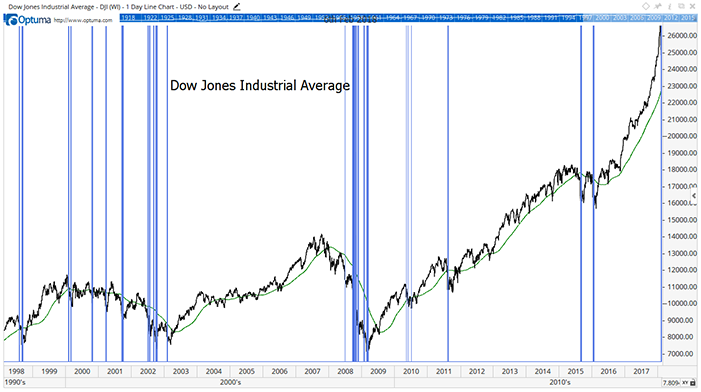
That high came less than two weeks ago. The speed of the sell-off was unusually fast. But the chart below shows that a quick decline like that isn’t all that unusual.
Vertical blue lines mark similar times in the past 20 years. Declines of 10% in less than two weeks are fairly common. Yet the most recent one stands out as unique.

The thin green line is the 200-day moving average (MA). Uptrends are times when the closing price is above the MA. When the closing price is below the 200-day MA, the market is in a downtrend.
Previous sell-offs like the one we saw this week occurred in bear markets. This has been true throughout market history. That is, until 2018.
That leads to the question: What does the drop in the Dow Jones mean?
Rapid selling is a sign of distress. It usually means large institutions need to raise cash. That almost certainly happened this week.
We know that billions in volatility funds were wiped out this week. There’s probably more that we don’t know about.
We’ve often seen rapid declines mark short-term bottoms in the stock market. That’s probably the case this time.
Look for higher prices in the next few months as buyers take advantage of the bargains a 10% decline always creates.
Regards,

Michael Carr, CMT
Editor, Peak Velocity Trader


