

As you know, the oil market has gone crazy the past few weeks.
You might be thinking of buying oil stocks now.
But there’s one important thing happening in the oil markets that no one’s talking about.
In today’s video, I have a chart that shows why oil’s price won’t stay high for long.
(If you’d prefer to read a transcript, click here.)
Hey everyone. Ian here with your weekly Winning Investor Daily update.
The biggest question on everyone’s mind right now is: Are commodities a sell? Is it time to get out of commodities?
We’ve seen incredible moves in oil, natural gas, wheat and nickel. I want to cover these charts in a moment.
Traditionally, when you see these super spikes in commodities, they’re followed by sharp reversals. Commodities don’t stay high for very long.
Let’s Look At The Oil Futures Curve
The reason for that is the cure for high commodity prices is high commodity prices.
What do I mean by that? Well, if the price of oil is high, it’s going to encourage countries and private companies to add more oil supply to the market because they want to sell more when prices are high.
And as they add more supply, the price comes down.
I want to take a look at a bunch of charts right now.
I’m going to walk you through exactly what I’m seeing in these markets and then talk to you a little bit about the oil futures curve. I’ll make it as simple as possible.
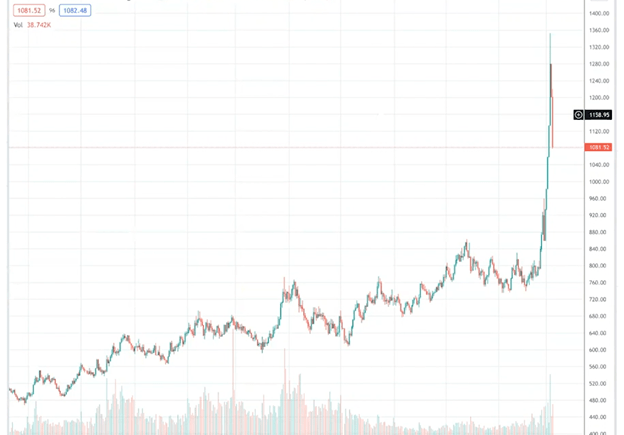
So, here’s chart of the price of oil. Each of these candles represents one day of trading.

Let’s rewind all the way to early 2021.
Back then, after the coronavirus sell-off started alleviating the price, in January 2021 it was about $35 to $40 a barrel.
We had a very strong uptrend throughout 2021. A lot of the sell-off here was in the fall. But then, as 2022 started, you started to see oil breakout to new highs.
It broke through the $84 level that it hit in October and was grinding up. Whenever you see these breakouts and a grind-up pattern, you wind up at some point with a blow-off top.
And what does the blow-off top signify? Well, it means that there’s a different type of buyer that entered the market.
Now, let me repeat that this is important when you see a chart change like this, from this grind up to when it just starts to gap up.
It means there’s a different type of buyer in the market. And the type of buyer that buys into this is two things.
One, it’s the “Johnny come lately” person that always buys things at the highs. And I’m sure everyone has a friend like that, or maybe a family member.
And other person that’s buying at any price is a short that wants to cover their short because they’re losing money.
We’re seeing similar things happen in other markets as well.
The wheat market has gone crazy in the last week. It’s up about 50%.
The wheat market is exploding higher because Russia and Ukraine sell 30% of the world’s wheat. They also make fertilizer and potash: things that we need to grow our crops.
Traders are anticipating low supply of wheat in the future. That’s why they’re buying it up now. So, we saw this super spike.
Another reason why we’re seeing the super spike in oil is that a couple of months ago, the oil curve went into something called contango. And it’s very rare that it goes to contango.
What it means is that each of the oil curves has different futures months that settle.

When the price of the front month is below the price of months further out on the curve, it goes into what’s called contango. That means the oil market is oversupplied.
If traders are willing to pay more for oil in the future than they are now, the futures market has flipped. That’s called backwardation. And right now, we’re in very steep backwardation.
The front end of the curve, where the spot price is now, is about $115 to $120. Or at least it was on March 4, when this curve was created.
The back month is all the way down to about $70. So, 60 to 90 days out you’re looking at much lower oil prices.
And why is this important? Because companies that are drilling for oil have to hedge their production risk in the futures market.
Let’s say you’re a large multinational oil company, and you’re thinking about adding to production.
You realize that the price of opening up a new well has significantly gone up because everyone’s rushing to do this at the same time. And you know the price of oil will be significantly lower from where it is now.
So, it means that these oil companies that are bringing new supply onto the market now aren’t going to have margins as high in the future as they do right now.
But I think that the most important thing that’s happening right now in the oil market is that the buyer has changed.
The buyer was grinding higher. And now the oil market, you know, had a classic blow-off top.
Now, it might get worse. I mean, we could see a prolonged Russian invasion into Ukraine that lasts months, maybe years. We could have oil trade at an elevated price from now into the future.
I think that countries like Saudi Arabia are going to increase production. U.S. companies are going to increase production, which will eventually bring the price lower.
And if you’re a trader, it’s always good to sell into these price spikes, especially if you’re along for the grind up.
What Is Happening With Nickle?
I want to cover one more market because this is just an incredible move in nickel this week.
Nobody really uses nickel. I mean, we use nickel for sterling silver. That’s about it. There’s copper in nickels right now, and that’s not even a big use case.
We just saw an incredible short squeeze where the price went from $2,000 up to $5,600.
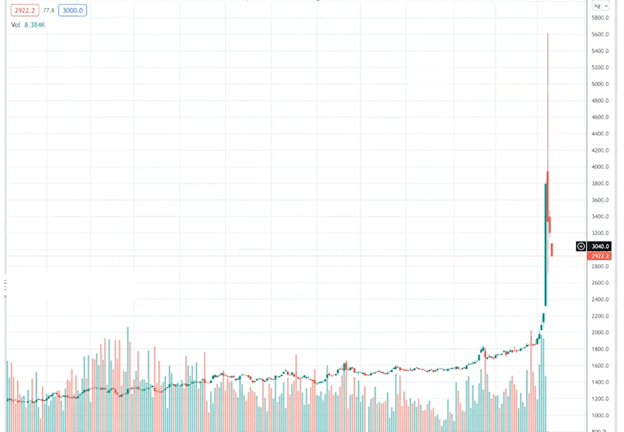
It tripled in one day on people who are short having to cover their short. It was a technicality.
I want to mention another use case for nickel. I know you guys are going to say I forgot this: You do use nickel in electric vehicle batteries. So, that’s another use case for nickel, although you don’t use as much as you do copper.
But anyway, I think this is tactical move in nickel, which is based on this short squeeze, and we’ll see this reverse when it gets to a price where demand starts to meet supply.
So, that is it. Any questions? Please feel free to leave us a comment below. We’d love to hear from you.
If you like this content, please hit the like button that allows us to share our content with other people on YouTube.
Other than that, have a great week, everyone. Thanks for tuning in, and we’ll speak to you next week. Take care.
Regards,

Editor, Strategic Fortunes
Morning Movers
From open till noon Eastern time.
Hycroft Mining Holding Corp. (Nasdaq: HYMC) is a precious metals mining company that is up 56% this morning. The stock is continuing on its upward trajectory that started with the Ukraine-Russia war fueling a price surge in gold, silver and other safe stores of wealth.
Lazydays Holdings Inc. (Nasdaq: LAZY) operates recreation vehicle (RV) dealerships under the Lazydays name. The stock jumped 23% on the news that one of its largest holders, B. Riley Financial, offered to buy the RV retailer for $25 per share in cash.
TeraWulf Inc. (Nasdaq: WULF) develops, owns and operates bitcoin mining facilities. The stock is up 22% as it continues to bounce back from earlier in the week when its price plunged to the lowest level since going public.
Humanigen Inc. (Nasdaq: HGEN) develops a portfolio of anti-inflammatory immunology and immuno-oncology monoclonal antibody therapies. It is up 20% after the company’s chief scientific officer disclosed a series of insider purchases of the stock.
Shoals Technologies Group Inc. (Nasdaq: SHLS) provides electrical balance of system solutions for solar, battery storage and electric vehicle charging infrastructure. It is up 17% after reporting record revenues and gross profit for the fourth quarter despite supply chain challenges.
Pearson plc (NYSE: PSO) provides educational materials and learning technologies. The stock is up 16% after Apollo Global Management confirmed that it is in the early stages of evaluating a possible cash offer for the company.
NN Inc. (Nasdaq: NNBR) manufactures and sells high-precision components and assemblies for the electrical, automotive, general industrial, aerospace and medical markets. It is up 13% after the company beat fourth quarter earnings by a wide margin and provided a strong outlook despite the macroeconomic headwinds the company is facing.
Red Robin Gourmet Burgers Inc. (Nasdaq: RRGB) develops, operates and franchises full-service and casual-dining restaurants. It is up 13% after the company reported fourth-quarter earnings showing that the business is returning to normal operating conditions as the Omicron variant recedes.
Just Eat Takeaway.com N.V. (Nasdaq: GRUB) operates an online food delivery marketplace globally. The stock is up 12% on reports that it is the subject of takeover speculation following the pressure it has been facing lately to explore strategic options.
TMC The Metals Co. Inc. (Nasdaq: TMC) explores for nickel sulfate, cobalt sulfate, copper and manganese products on the seafloor. The stock is up 10% as investors, political leaders and businesses turn their focus to the seabed for key metals like nickel in these low-supply conditions.

