The market is measured by the performance of the S&P 500. A rule of thumb is to expect an average return of 10% a year, but in the 21st century, that hasn’t worked out yet.
Over the past 17 years, the average annual return is just 4% — less than half our rule of thumb.
That means every $10,000 you invested 17 years ago would be worth just $16,800 today.
If we were averaging 10% a year, that $10,000 would have turned into $27,000 over the same time frame.
And this period includes the dot-com bubble in the early 2000s … the global financial crisis in 2008 … the Federal Reserve’s easy-money policies … global uncertainty … etc.
In short, it covers the gamut of market situations.
The truth is, the standard buy-and-hold strategy has failed you — catastrophically.
What’s worse is this fate could have been avoided. Let me explain…
Confessions of a Wall Street Insider
Hindsight is always 20/20, but the reality is that the buy-and-hold strategy is not working out in the 21st century thus far.
Instead of settling for the indexed returns, there’s a better strategy that could have avoided this fate. And when the average annual return of the index exceeds 10%, this method still outperforms.
I’m talking about a little-known but incredibly powerful document that one group has used as early as the mid-1960s to consistently outperform the market.
The document is an everyday item, a calendar, but it’s notated with important trends that helped guide Merrill Lynch to triple the market’s returns over a 10-year period … and it traded just seven sectors of the market.
Now, I wouldn’t tell you all this just to tease a concept that I haven’t perfected. The truth is, you’re in luck.
Because not long ago, I got my hands on the original calendar that Merrill Lynch based its research on.
And with it, I’ve created what I consider the easiest, most hands-off way for the conservative investor to achieve truly fantastic wealth. Take a look:
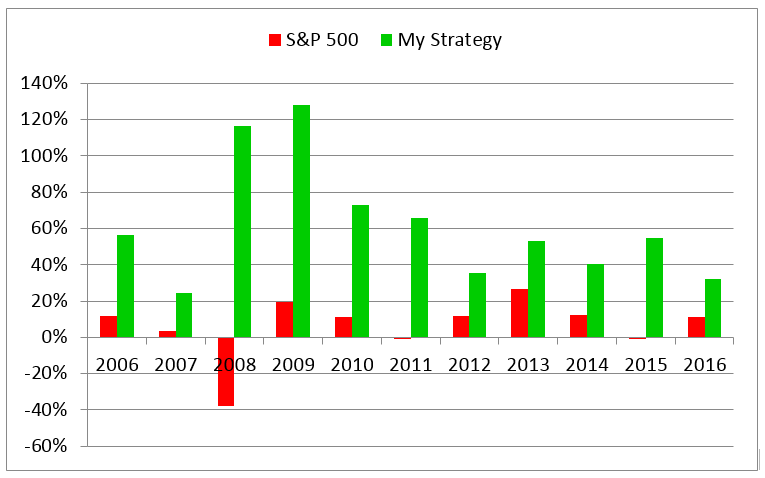
This is a chart of the backtested returns of my strategy (in green) versus the S&P 500 (in red), and you can see that the results are nothing short of phenomenal.
Not only did my strategy outperform the S&P 500 every year — even when the S&P 500 posted 20%-plus returns — but my strategy performed the best in the most volatile of times: 2008 and 2009.
See, I took the premise of the calendar that helped Merrill Lynch triple the market returns, and I modified it.
The modifications I made focused on key sectors of the stock market and pinpointed the seasonal trends in them that were the most profitable and extremely consistent.
But that’s only part of it.
Instead of sticking with an overall sector, I used those seasonal patterns to pick the stock with the best expected return during that seasonal trend — and that’s how I generated market-beating returns.
You can begin harnessing this strategy to alter your financial destiny too.
Regards,

Chad Shoop, CMT
Editor, Automatic Profits Alert