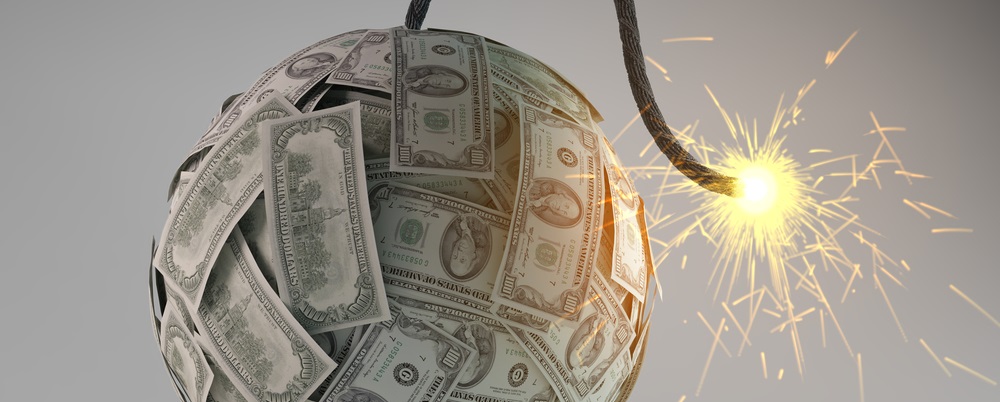
So far as I can tell, President Donald Trump has done little to change the circumstances that led him to declare in April 2016 that the U.S. was headed for “a very massive recession.” His promise of “big league” tax reform has been described by a lobbyist as “a big nothing burger.”
Trump’s opinion as a candidate could be of importance to you as an investor. He said last year: “It’s a terrible time right now to invest in the stock market.”
Hear! Hear!
If Trump was right then, his conclusion would seem to be even more valid now.
Today’s cyclically adjusted price-to-earnings ratio, or CAPE, is 29.27, as compared to an already high 25.92 in April of last year when Trump warned that the market was dangerous.
Under sane and sound conditions, the performance of individual stocks is determined by the execution of their business plans — not by political authorities or the unelected mandarins at the Federal Reserve.
As they talk about “draining the swamp” of crony capitalism, politicians should not be manipulating your stock portfolio. But they are. Or at least they are trying.
Historical Bubbles
I have made a hobby of studying past stock market manias looking for clues to help you get a better view of when the current bubble may end, and the likely consequences. As you know, we have not experienced sane and sound conditions for years.
Quite the contrary. As you are aware, we are in the midst of the biggest stock bubble in American history. In all probability, it is the biggest stock bubble in human history.
Some might suppose that the Wall Street market crash of 1929 ended the biggest bubble ever. It was the first stock mania in the era of American hegemony. The Allied victory in World War I, in conjunction with the impairment of British financial capabilities, set the stage for euphoric optimism in the Roaring Twenties.
President Herbert Hoover, who was praised by economist John Maynard Keynes as the only person to emerge from the Versailles Peace Conference with his reputation enhanced, was widely despised for causing the Great Depression. It is now forgotten that the worldwide depression supposedly started by Hoover’s inability to head off the stock market collapse of 1929 was already underway as early as 1927.
Commodity-producing economies on the periphery, such as Argentina, Australia and Brazil, along with troubled European economies, notably Germany, had already sunk into depression.
The excess capacity in commodity production, stimulated by the breakdown of trade in World War I, depressed prices for producers.
This commodity depression was reflected in the crash of the London stock market, which mainly capitalized the operations of hard and soft commodity producers throughout the British Empire, and preceded Wall Street’s October 1929 plunge by a month.
An Inescapable Bubble
Weakness in commodities is likely to precede the next big crash. Of course, that opens the door to trouble at almost any time. Industrial commodities, particularly iron, copper and oil, have been chronically weak.
Unlike the run-up to the 1929 crash, the current weakness in commodity prices is mainly attributable to the opening of the Chinese economy, in conjunction with the quantitative easing policies of the Fed and central banks in other advanced economies.
Those actions resulted in the lowest interest rates seen in 5,000 years! Add in the demand from China, ramped up by promiscuous credit expansion, and you have a recipe for massive commodity expansion and overcapacity.
As we have explored in Strategic Investment, China consumed more cement between 2011 and 2013 than what was used in the United States in the entire 20th century. Similarly exaggerated demand for iron, copper and other industrial commodities underpinned huge expansions of capacity and debt levels.
A recent report by Andrew Brown, partner for macro and strategy at ShoreVest Capital Partners, concludes that it is China’s turn to deflate its credit excesses. These are arguably the most extreme in history. China created debt equivalent to 139% of its gross domestic product between the first quarter of 2009 and the third quarter of 2014 when Chinese growth peaked. This debt explosion was far in excess of the debt created in other major credit bubbles around the globe.
China’s excess credit, as measured by the Bank for International Settlements, is equivalent to about $3.1 trillion. The bubble is unquestionably a feature of current stock markets.
A Crash Is Coming
Once a bubble has been inflated, I know of no example where one was calmly deflated, short of a crash. Of course, that doesn’t mean that everyone must be equally affected.
Note that some experts have suggested that the late 1990s dot-com boom was a bigger bubble than today because the price-to-earnings (P/E) ratio for the Nasdaq in 1999 was higher. As true as that statistic is, it paints a false picture. The reason?
Over the last 18 years, the powers that be have tweaked accounting standards to permit companies a greater latitude in declaring fanciful earnings. The result?
If you adjusted the earnings of S&P 500 companies to reflect the generally accepted accounting principles in force in 1999, today’s earnings would shrivel by at least half.
That would make the market about two times more expensive than it already is. So a P/E of 29 today, using 1999’s accounting standards, would be 58 or higher!
Prudence suggests backing out of unhedged passive long investments in the U.S. market.
Sincerely,

James Dale Davidson
Editor, Strategic Investment
P.S. I have identified five key signs that a massive crash is going to hit the American stock market, crushing our financial system. However, that doesn’t mean that you can’t prepare now to protect your wealth and potentially even profit. To learn what you can do now, click here.


