
On March 9, I cautioned you that we were about to enter a period of prolonged volatility…
And that’s exactly what we saw.
The S&P 500 Index has plunged as much as 8% since that day, and the volatility in the market is nerve-racking.
A 1% move in the broad market now takes just hours, compared to what would have taken days to amass during all of last year.
But just as my chart of moving averages showed this was coming, it is also showing that the end of this slump in the market is near, and now is a great time to jump in.
Take a look:
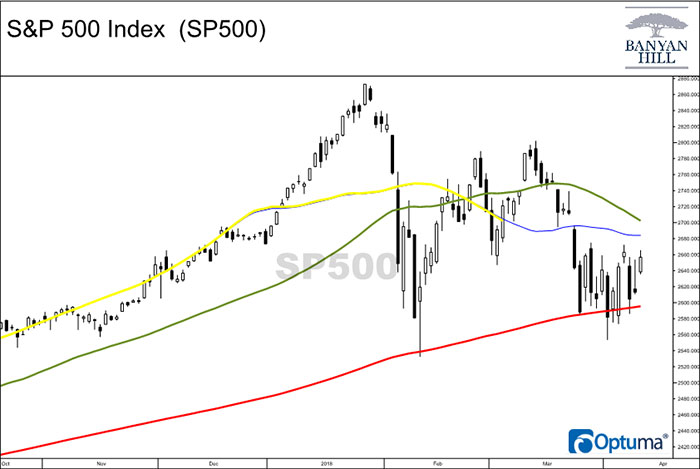
In the chart, the red line is a simple 200-day moving average, an average almost all traders follow.
The green line is the 50-day moving average, and the yellow line is the 50-day moving average offset by 25 days.
The blue line is my forward indicator for the yellow line, because the data continues to change until it is 25 days old. At that point, it is our 50-day moving average offset by 25 days (the yellow line).
This yellow line is the key one, but the blue line is our indicator for where it is headed.
And just as it showed it was about to cross below the green line a month ago (which was bearish), it now shows that it is set to climb back above the green line — a bullish move.
This is why jumping in now is a great time to buy the dip.
I know, it may seem nerve-racking to enter with such volatility, but start small.
Buy some stocks to benefit from the quick rally, but keep some cash on the side due to the volatility that you can put to work once the market has turned the corner and is officially out of the stock market correction.
Regards,

Chad Shoop, CMT
Editor, Automatic Profits Alert

