Over the past few months, stocks have roared to new highs almost every single day, and investors are eager to participate in the rally.
It’s this type of risk-on environment where you typically see investors selling bonds to move even more cash into stocks.
But investors are also buying bonds, pushing those prices higher as well.
This is contradictory to what we take for granted — that there is an inverse relationship between the stock market and bond prices.
While many are calling for concern over this, based on the data, this isn’t something to be alarmed about…
The Cash Flow
First, let’s discuss why this is such a given concept — that as stocks go higher, bonds typically head lower.
The rationale is that bonds are the safe place to park your cash. So when uncertainty is on the rise, and you are worried about economic growth, you dump your cash into bonds to preserve capital and earn a small amount of yield. This pushes the yields on bonds down and prices higher.
This cash doesn’t come out of thin air, either. It usually comes out of stocks, as investors sell stocks and move into bonds.
And investors reverse that action when the market is strong, selling bonds to buy stocks — which pushes bond prices lower and their yields higher.
There are a few instances where it’s logical to see the positive correlation like we have now — such as low interest rates, low inflation and skepticism about stocks.
For a time, both bonds and stocks can move in the same direction.
But eventually one or the other will be right.
Either bonds will be the best asset to hold, or everyone will move back into stocks.
I dug into the data to see how it has shaped up in the past, and the results were promising.
The Data Says…
The data test was simple.
I ran the correlation between the stock market and bonds over three-month periods going back to 2000.
Then I tracked the performance over the following 12 months, and here’s what I discovered: It’s actually a positive sign for the markets.
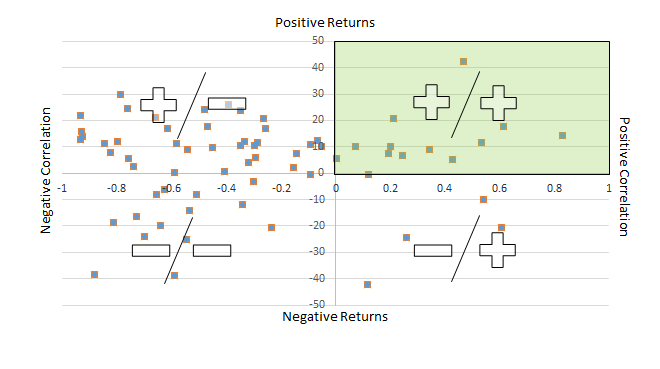
Take a look at the green shaded box in the chart below:

The green box represents the three-month periods since 2000 when both the correlation and returns were in positive territory. Below that shows you the periods where the correlation was positive, but the return was negative.
As you can clearly see, more times than not the returns were up nicely after a positive correlation between stocks and bonds.
Also note that on the left side of the chart are all the periods where there was a negative correlation — clearly more often than the positive correlation we are experiencing today.
That’s why it’s important to analyze the data.
Don’t Get Spooked
By following some of the headlines today, you wouldn’t know what action to take — and new headlines and data come out every day.
But based on these results, had you exited the market every time there was a positive correlation between stocks and bonds, you would have missed out on some solid 10% to 40% rallies in the stock market.
That’s why even though a positive correlation doesn’t happen often, and it may spook investors when it does, it’s actually a sign for robust stock market returns in the coming 12 months.
Based on my data, in only four of the past 17 times when there was a positive correlation between stocks and bonds did the market have negative returns over the following 12 months.
So owning stocks, not bonds, over the next 12 months puts the odds in your favor to grow your account.
Regards,
Chad Shoop, CMT

Editor, Automatic Profits Alert


